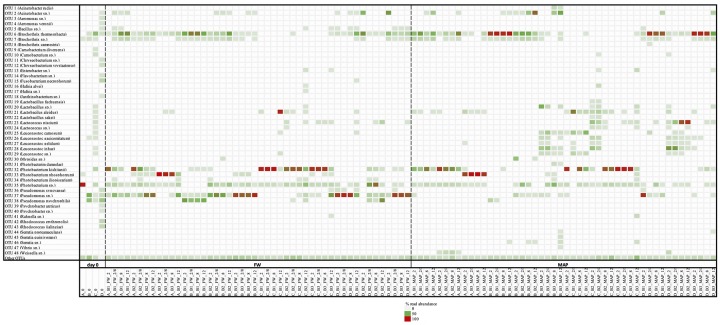
FIGURE 5.
Heatmap of relative read abundance at species level for all samples (expressed in %) among the different storage conditions. Only the most abundant OTUs obtained in this study are specially indicated (>1%). Others OTUs are gathered in “Others OTUs.” Legend: food companies (A–D), with three batches each (B1, B2, B3), analyzed at the first (0) and the last day of storage, in food wrap (FW) and modified atmosphere (MAP) packaging. Temperature of storage: 2°C (2), 8°C (8), 12°C (12), and for a third of the shelf life at 2°C and for the rest of the shelf life at 8°C (2/8).

