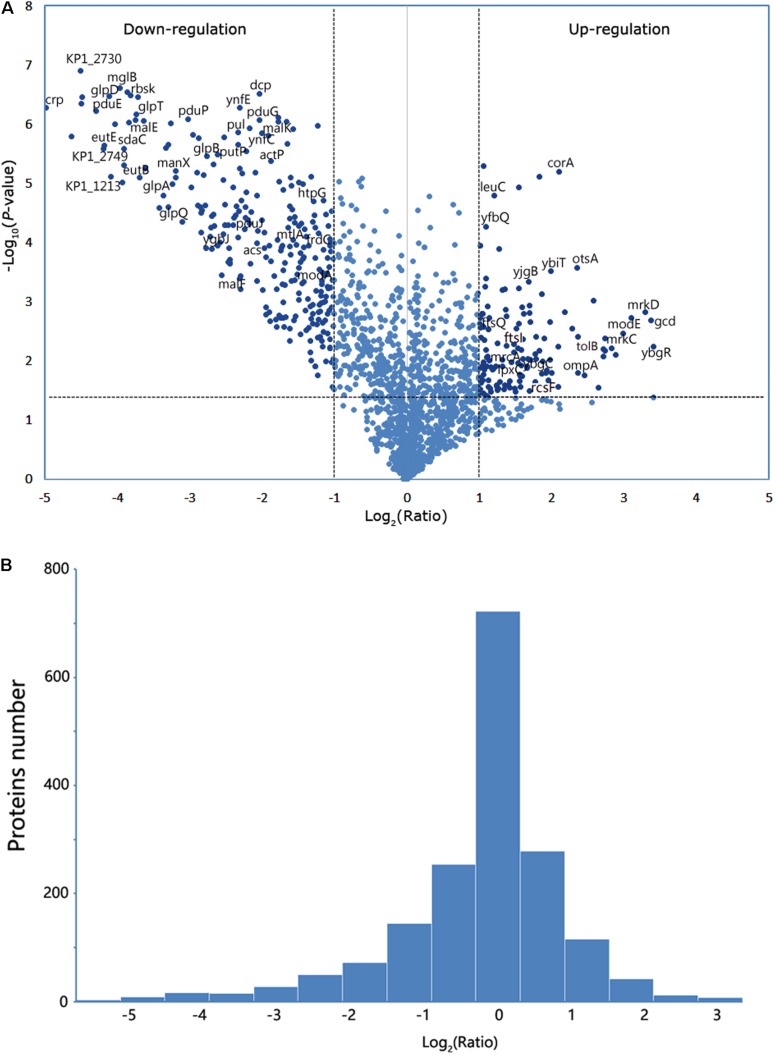
FIGURE 2.
Analysis of the mass spectrometry data. (A) Volcano plot from the mass spectrometry data demonstrates the magnitude and significance of the cellular proteins from the deletion strain compared with the control (WT). Horizontal dashed line shows where p-value is 0.05 [-log10 (0.05) = 1.3], and the vertical dashed lines show where the fold change is 2 [log2 (2) = 1] or 0.5 [log2 (0.5) = -1]. The twofold change and p-value of 0.05 were used as the threshold cutoff. (B) The number of proteins was counted according to the fold change of log2 (ratio).

