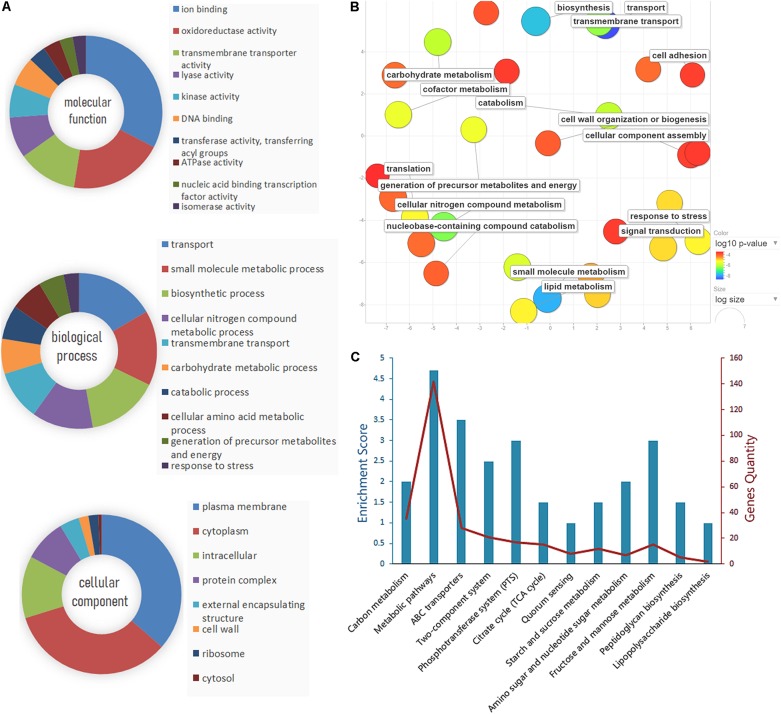
FIGURE 3.
Gene Ontology (GO) analysis and pathway enrichment analysis of the differential expression proteins. (A) GO annotation of the differential proteins identified by liquid chromatography with tandem mass spectrometry (LC-MS/MS), including molecular function, biological process, and cellular component. (B) The enriched GO categories were analyzed by the REVIGO tool. The colored spots showed the regulatory proteins which appeared to be commonly involved in the major biological functions. (C) Pathway enrichment and gene quantity analysis of differentially expressed proteins.

