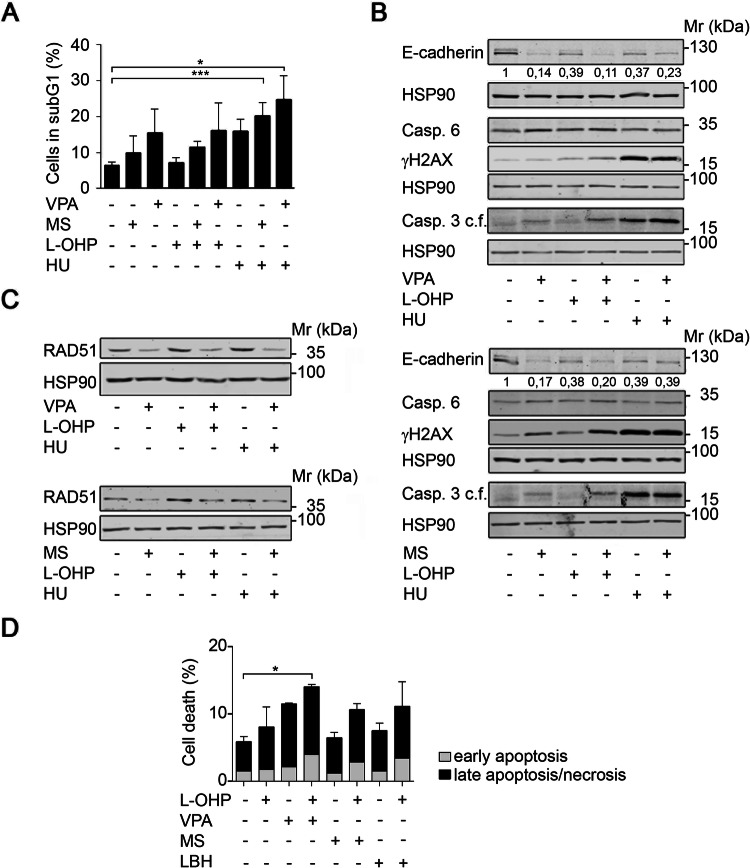
Fig. 3.
HDACi interact with chemotherapeutics. a Renca cells were pre-treated for 24 h with 1.5 mM VPA or 1.5 μM MS-275 and subsequently treated with 5 μM L-OHP or 1 mM HU for 24 h. Cell death was accessed as % subG1 population in fixed, PI-stained cells using flow cytometry. Graph shows mean ± SD (n = 3); *p value = 0.0101; ***p value = 0.003; one-way ANOVA. b Renca cells were treated with 1.5 mM VPA, 1.5 μM MS-275, 5 μM L-OHP, and 1 mM HU as indicated for 48 h. Expression levels of the indicated proteins were analyzed by Western blot. Band intensities for E-cadherin are indicated, with untreated cells set as 1 (n = 2). HSP90 serves as loading control; relative molecular mass in kilo Daltons (kDa). c Renca cells were pre-treated for 24 h with 1.5 mM VPA or 1.5 μM MS-275 and subsequently treated with 5 μM L-OHP and 1 mM HU for 24 h. Expression of RAD51 was assessed by Western blot. HSP90 serves as loading control; relative molecular mass in kilo Daltons (kDa) (n = 2). d H1299-TO-p53 cells were treated with HDACi (2 µM MS-275, 30 nM LBH-589, 3 mM VPA) and/or oxaliplatin (5 µM L-OHP) for 24-48 h. Annexin V/PI-stained cells were subjected to flow cytometry for cell death analyses; n = 3 ± SD; *p value < 0.05, two-way ANOVA

