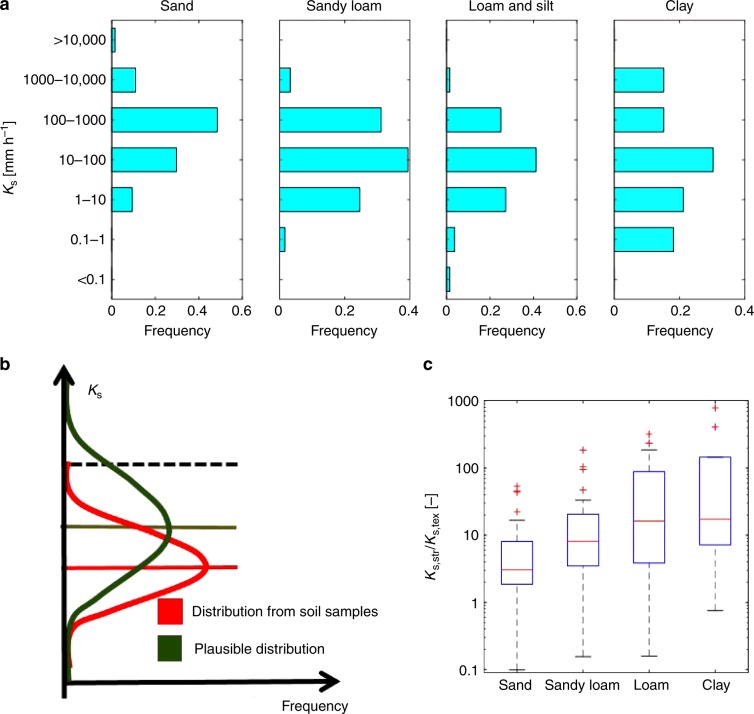
Fig. 1. Biases in current soil hydraulic conductivity parameterizations.
a Distribution of saturated hydraulic conductivity subdivided for soil-textural types (sand, sandy loam, silt and loam combined, and clay) for undisturbed samples only of the UNSODA database (Nemes et al.46 and Børgesen et al.47). b Hypothetical distributions of soil saturated hydraulic conductivity (Ks) obtainable from soil cores vs. rarely observed structured soil samples. The dashed line delimits the largest value of Ks related to texture. Solid lines are the medians of the two distributions. c Distribution of the ratio between structural and textural saturated conductivity Ks,str/Ks,tex subdivided for soil-textural types (data from Weynants et al.39). The box length provides the interquartile range (IQR), the bottom of the box the 25th percentile (first quartile, q1), the top of the box the 75th percentile (third quartile, q3), and the horizontal line within the box the median value. The lower whisker corresponds to q1 − 1.5IQR and the upper whisker corresponds to q3 + 1.5IQR; outliers are plotted individually.

