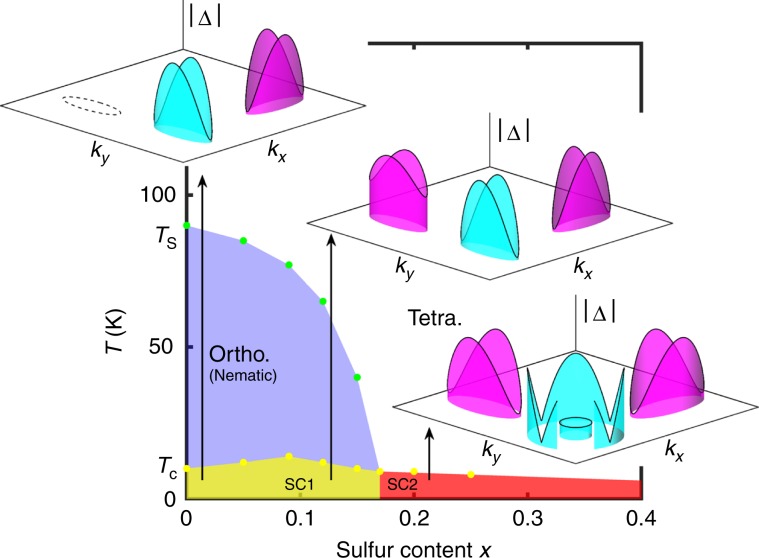
Fig. 1. Schematic plot of the phase diagram and intra-pocket order parameters used on the electron and hole bands in different phases across the transition.
Light blue and purple colors refer to assumed opposite signs of order parameters on hole and electron pockets, which are, however, qualitatively irrelevant for the conclusions discussed here. Dashed Fermi surface in x = 0 case refers to pocket that has not been observed spectroscopically. Data from refs. 17–24.

