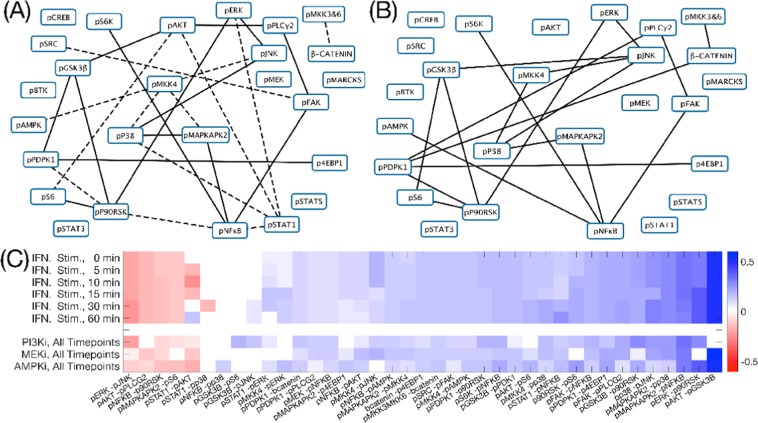
Figure 5.
Network reconstruction from IFNγ stimulation experiments. (A) Reconstructed signaling pathway from the IFNγ stimulated time-course experiment. (B) Reconstructed signaling pathway from a time-course experiment that combined stimulation of IFNγ and PI3K inhibition (reconstructed signaling pathways from other inhibition time-course experiments are shown in the Supplement Fig. SI.11.7). For both figures (A,B), the edges with solid lines represent stable undirected relationships between proteins across all time-points and the dashed lines connect protein pairs that are partially correlated only for some time points. (C) Heatmap of the estimated partial correlation using all four available mass-cytometry time-course datasets. All datasets are IFNγ stimulated and three additional experiments are perturbed with inhibitors of PI3K, AMPK and MEK1/2 for validation purposes. The heatmap shows the estimated partial correlation of the union of top 20 protein-pairs selected from different biological experiments.

