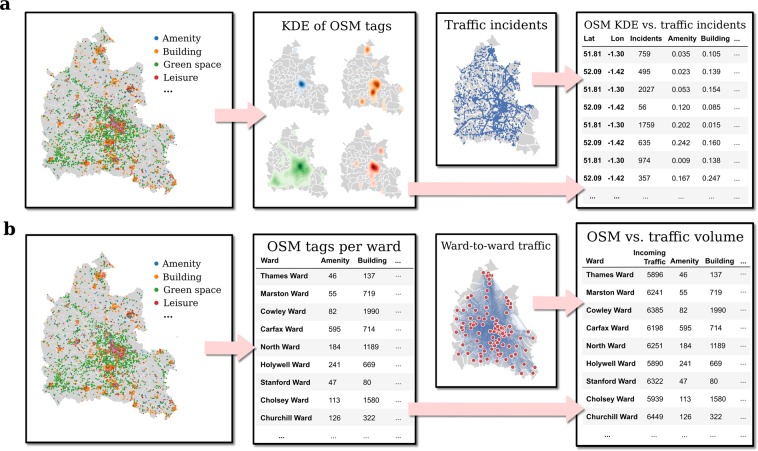
Figure 1.
Schematic pipeline of the linear model for the two sets of linear models in this study. As shown in the top panels (a), we first produce kernel density estimates (KDE) of every OpenStreetMap (OSM) category and meta-category, which we then compare with the number of traffic disruptions at a given latitude and longitude. The bottom panels (b) show we also aggregate the OSM data points into a total count per ward, which we then compare with the traffic volume going into every ward in Oxfordshire.

