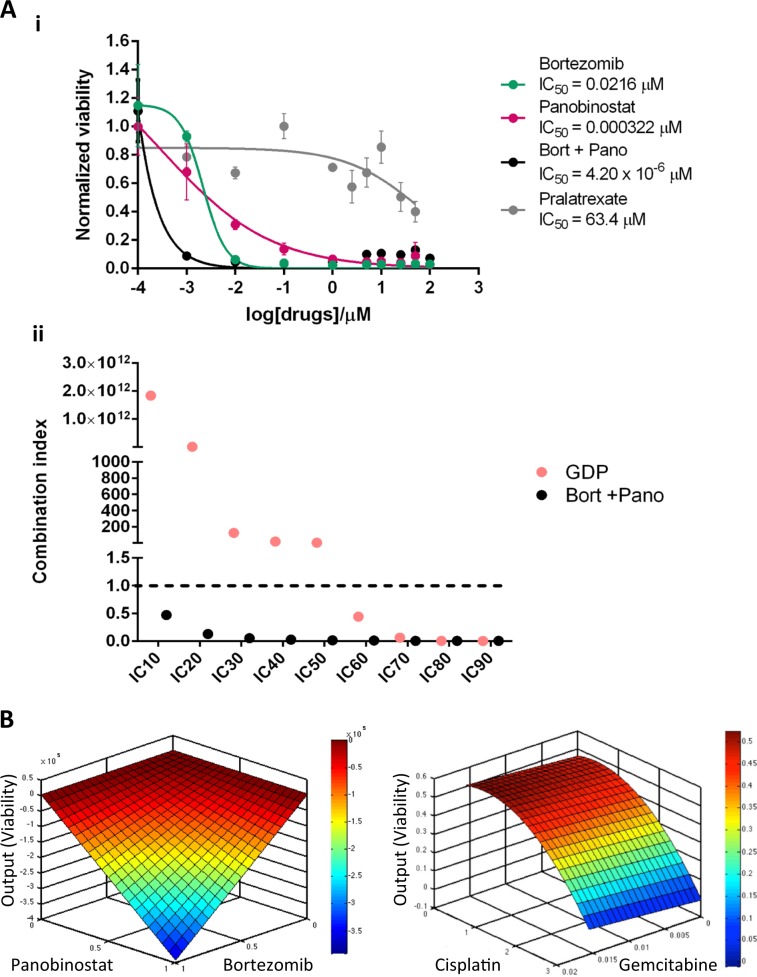
Fig. 1. Ex vivo drug sensitivity results.
Ex vivo synergistic interaction of combinatorial therapy BP, compared to chemotherapy (a(i)) dose-response curve of bortezomib, panobinostat and pralatrexate as single agents, and the BP combination. The IC50s were 0.0216 μM, 0.000322 μM and 63.4 μM for single agent bortezomib, panobinostat, and pralatrexate respectively. (a(ii)) combination indices of BP in relation to GDP. Data are presented as means ± SD of three technical replicates. b Response surface maps illustrating the interaction between BP (left panel) and Gem-Cis (right panel).

