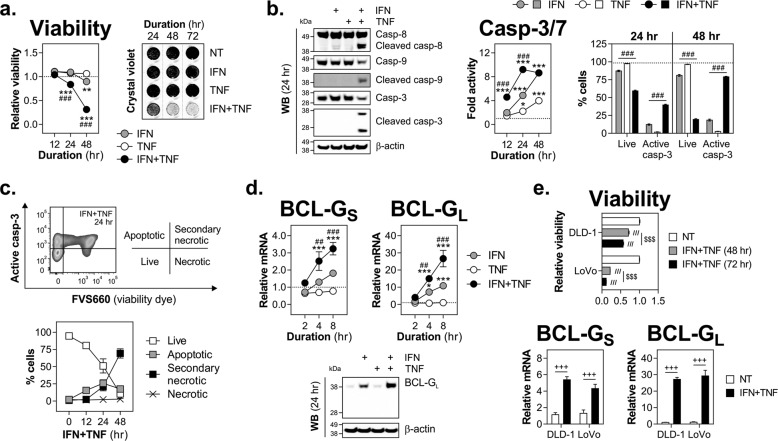
Fig. 2. Th1 cytokines IFN-γ and TNF-α synergise to induce BCL-G expression and apoptosis of human IEC.
a–d HT-29 cells were treated with IFN-γ (10 ng/ml), TNF-α (10 ng/ml) or IFN-γ+TNF-α (10 ng/ml each) for the indicated time points. a Relative cell viability and crystal violet staining of HT-29 cells treated as indicated. For viability, a black dotted line indicates viability of non-treated cells. For crystal violet staining, grey dotted lines indicate splicing of images. b Western blots showing levels of caspase-8, caspase-9 and caspase-3 (total and cleaved) in HT-29 cells treated for 24 h as indicated (left). Caspase-3/7 activity in cytokine-treated HT-29 cells measured over time. A black dotted line indicates caspase-3/7 activity of non-treated cells (middle). Percentage of live cells and active caspase-3+ cells following cytokine treatment over time. A black dotted line indicates % of live cells in the non-treated group. Data shown are the mean ± S.D. of n = 3 independent experiments in duplicates (right). c Cell death profile of HT-29 cells treated over time with IFN-γ+TNF-α, and stained for active caspase-3 and fixable viability dye FVS660. Data shown are the mean ± S.D. of n = 3 independent experiments in duplicates. d Relative mRNA expression of BCL-GS/L in cytokine-treated HT-29 cells measured by RT-qPCR over time. A black dotted line indicates BCL-GS/L expression in non-treated cells (top). Western blot showing levels of BCL-GL in HT-29 cells treated for 24 h as indicated (bottom). e DLD-1 and LoVo cells were treated with IFN-γ+TNF-α (10 ng/ml each) for the indicated time points. Relative cell viability was measured over time (top) and relative mRNA expression of BCL-GS/L was measured by RT-qPCR at 8 h (bottom). Unless specified otherwise, data shown are the mean ± S.E.M. of n = 3 independent experiments. *p < 0.05, **p < 0.01 and ***p < 0.001 (two-way ANOVA followed by Tukey’s multiple comparisons test vs. non-treated cells), ##p < 0.01, ###p < 0.001 (two-way ANOVA followed by Tukey’s multiple comparisons test vs. IFN-γ), ///p < 0.001 (one-way ANOVA followed by Tukey’s multiple comparisons test vs. non-treated cells), $$$p < 0.001 (one-way ANOVA followed by Tukey’s multiple comparisons test as indicated), +++p < 0.001 (unpaired, two-tailed Student’s t-test as indicated). NT — non-treated.

