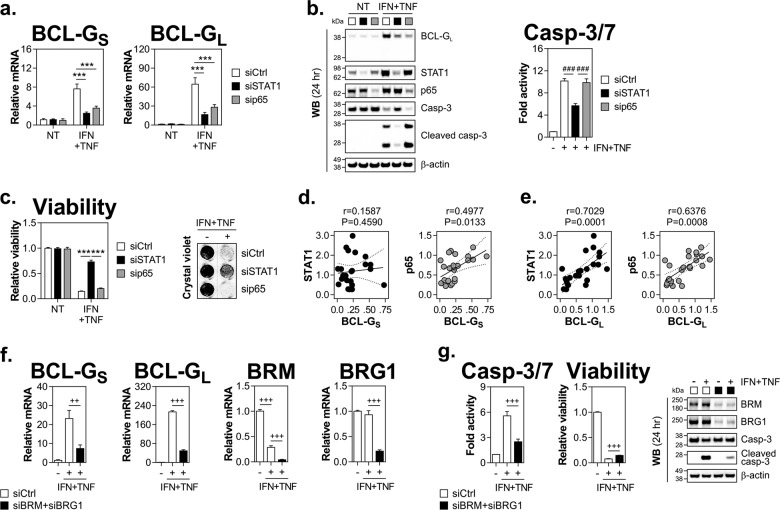
Fig. 4. STAT1, NF-κB/p65 and SWI/SNF chromatin remodelling complex are required for BCL-G induction by IFN-γ and TNF-α.
a–c HT-29 cells transfected with a non-targeting siRNA (siCtrl), siRNA targeting STAT1 (siSTAT1) or NF-κB/p65 (sip65) were stimulated 48 h later with IFN-γ (25 ng/ml) and TNF-α (50 ng/ml) for various time points. a Relative mRNA expression of BCL-GS/L as measured by RT-qPCR at 4 h. b Western blots showing levels of BCL-GL, STAT1, NF-κB/p65 and caspase-3 (total and cleaved) 24 h after cytokine treatment (left). Caspase-3/7 activity as measured at 24 h (right). c Relative cell viability and crystal violet staining of HT-29 cells treated as indicated for 48 and 72 h, respectively. For crystal violet staining, a grey dotted line indicates splicing of images. d Spearman correlation between BCL-GS and STAT1 (left) or NF-κB/p65 (right) relative mRNA levels in colonic biopsy tissues of patients with active ulcerative colitis. e Spearman correlation between BCL-GL and STAT1 (left) or NF-κB/p65 (right) relative mRNA levels in colonic biopsy tissues of patients with active ulcerative colitis. f, g HT-29 cells transfected with a non-targeting siRNA (siCtrl) or siRNAs targeting BRM (siBRM) and BRG1 (siBRG1) were stimulated 48 h later with IFN-γ (25 ng/ml) and TNF-α (50 ng/ml) for various time points. f Relative mRNA expression of BCL-GS/L, BRM and BRG1 as measured by RT-qPCR at 8 h. g Caspase-3/7 activity at 24 h (left), relative viability at 48 h (middle) and western blots showing levels of BRM, BRG1 and caspase-3 cleavage at 24 h (right) in HT-29 cells treated as indicated. Data shown are the mean ± S.E.M. of n = 3 independent experiments. ***p < 0.001 (two-way ANOVA followed by Tukey’s multiple comparisons test as indicated), ###p < 0.001 (one-way ANOVA followed by Tukey’s multiple comparisons test as indicated), ++p < 0.01, +++p < 0.001 (unpaired, two-tailed Student’s t-test as indicated). NT — non-treated, r — Spearman correlation coefficient, P — two-tailed p-value of Spearman correlation.

