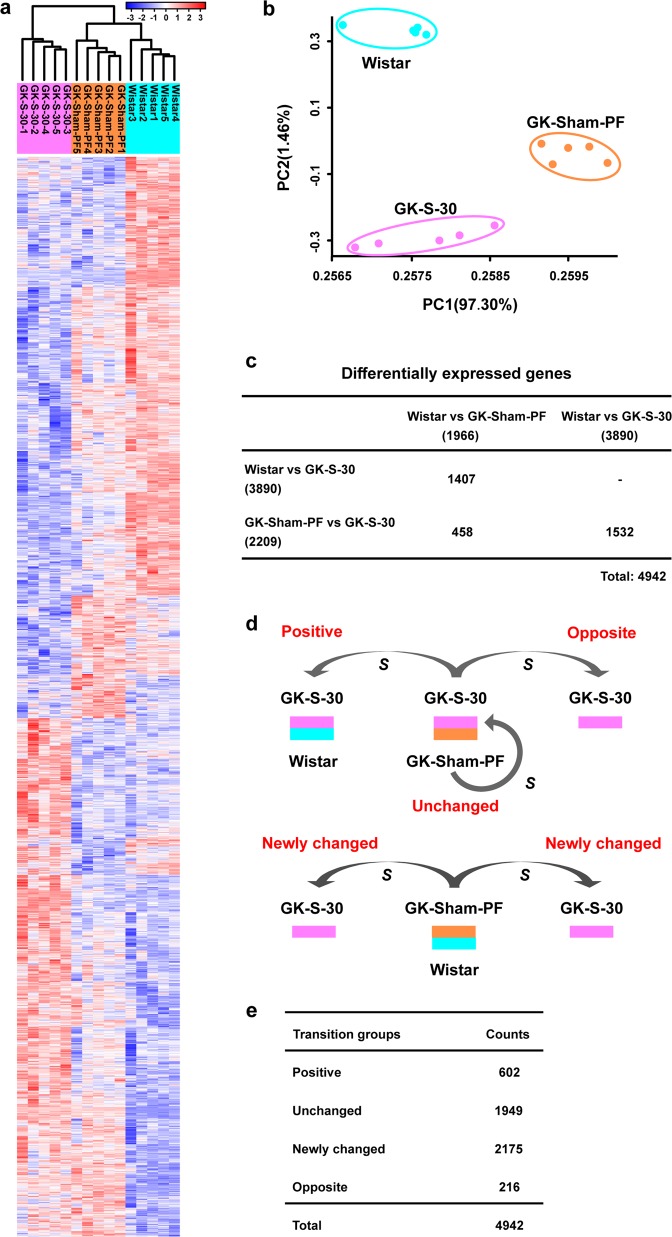
Fig. 2. Analyses of transcriptomic profiles among three physiological states.
a Heatmap illustrating dynamics of 4942 DEGs among the three state groups (normal Wistar, diabetes-GK-PF, diabetes remission-GK-S (short for GK-S-30)). Unsupervised hierarchical clustering was performed to distinguish among physiological states. The three types of rats were distinctly clustered into three independent groups, indicating that physiological state of diabetes remission by RYGB differed strongly from both normal and diabetic states. b PCA results showing visually that the three types of rats were clustered distinctly into three independent groups, confirming similar results from hierarchical clustering. c Few overlapping DEGs in comparison with pairwise groups, with no statistical significance by the hypergeometric test (all P values are 1). d Schematic diagram illustrates four transition groups (positive, unchanged, opposite, and newly changed) of DEGs to fractionize functional roles of DEGs and clarify relationships between RYGB-associated and diabetes-associated changes at the gene expression level. S: surgery. e DEGs in the four transition groups were counted. Most of the DEGs belonged to the unchanged and newly changed groups. Positive group was out of proportion to unchanged group.

