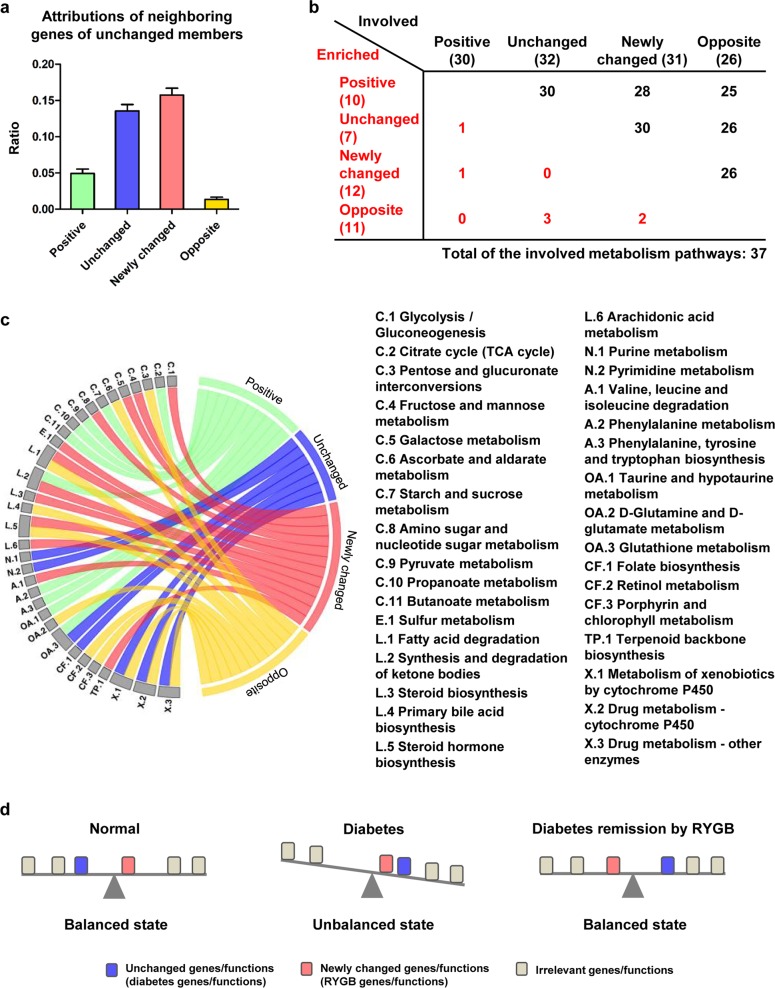
Fig. 3. Rebalance model to explain compensatory strategy of diabetes remission by RYGB.
a Histogram showing distributions of neighboring nodes of unchanged genes in four transition groups. b Overlapping functional analysis in a total of 37 metabolism-associated processes significantly enriched by each of four transition groups. c Enriched metabolism-associated pathways by four transition groups graphically shown in detail. C carbohydrate metabolism, E energy metabolism, L lipid metabolism, N nucleotide metabolism, A amino acid metabolism, OA metabolism of other amino acids, CF metabolism of cofactors and vitamins, X xenobiotic biodegradation and metabolism. d Schematic diagram illustrating rebalance strategy of diabetes remission by RYGB. Blue block: diabetes-related genes/functions not recovered by RYGB (unchanged group). Red block: newly changed genes, i.e., diabetes-irrelevant genes unusually expressed after RYGB. Not all diabetes-related genes could be restored following RYGB, but the physical system rearranges other normal metabolic pathways, newly changed “dysfunctions”, which unexpectedly improve metabolic parameters and rebalance the abnormalities caused by unchanged diabetes-associated genes. In a and c, positive transition group is indicated by green color, unchanged group by blue, newly changed group by red, and opposite group by yellow.

