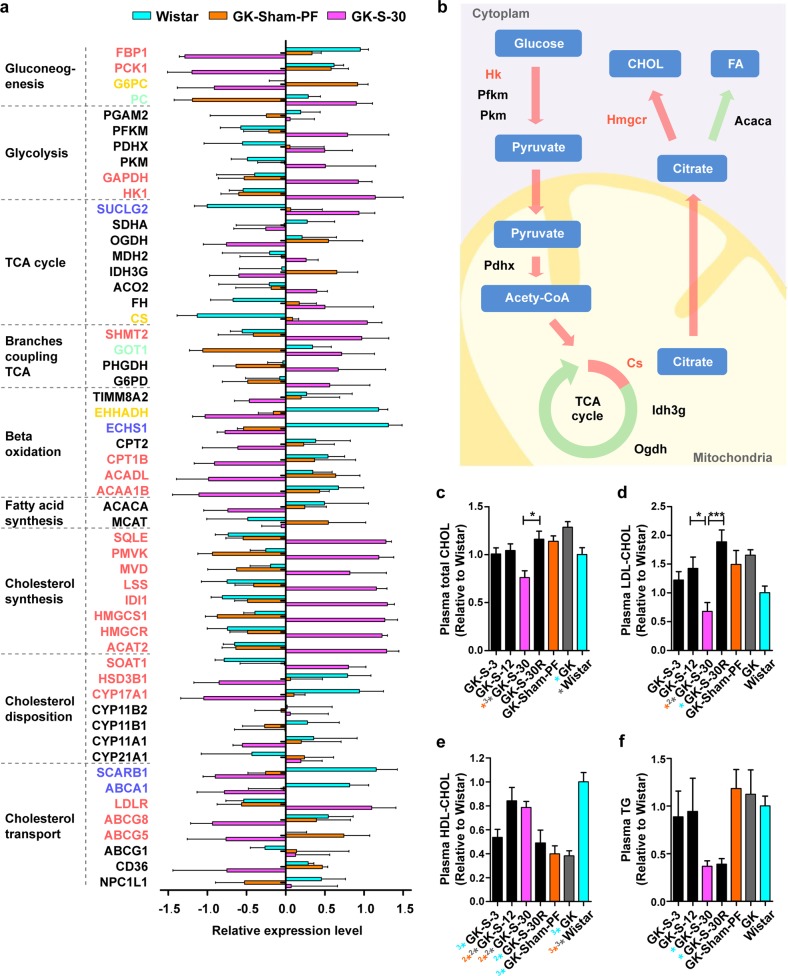
Fig. 4. Increase in newly synthesized HDL-CHOL contributes to glycometabolism rebalance.
a Changes in expression of key enzymes of glucose and CHOL metabolism in three groups (Wistar, GK-PF, GK-S-30; each n = 5) in terms of relative mRNA level. Gene symbols are colored green for positive transition group; blue: unchanged; red: newly changed; yellow: opposite; black: non-DEGs. b Schematic diagram showing that increased de novo CHOL synthesis in RL has direct beneficial effect on glycemic control after RYGB. c Plasma total CHOL, d plasma LDL-CHOL, e plasma HDL-CHOL, and f plasma TG were measured in overnight-fasted blood samples from GK and Wistar groups. Data are expressed as mean ± SE. Statistical terms (n ≥ 6) and symbol colors as in Fig. 1.

