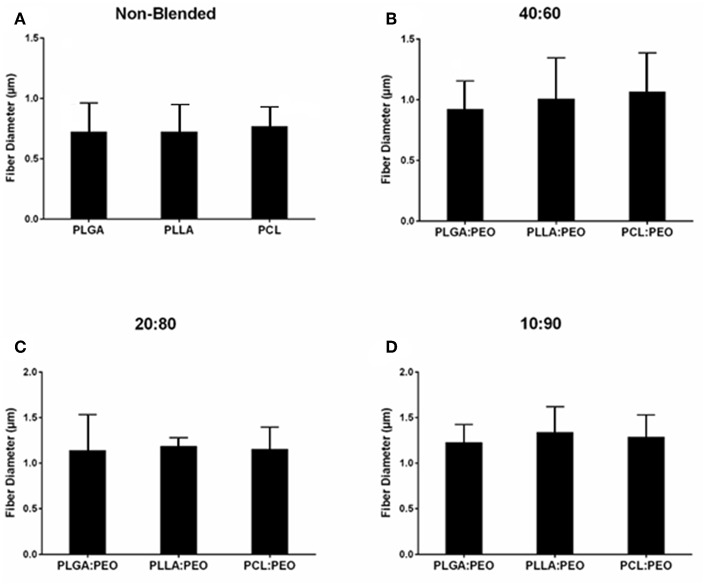
Figure 2.
Average diameters of electrospun fibers measured from SEM images, using ImageJ. (A) Non-blended and blended (B) 40:60, (C) 20:80, and (D) 10:90 PLGA:PEO, PLLA:PEO, and PCL:PEO 1% w/w BAR fibers. Error bars represent the mean ± the standard deviation (n = 3) of three independent experiments.

