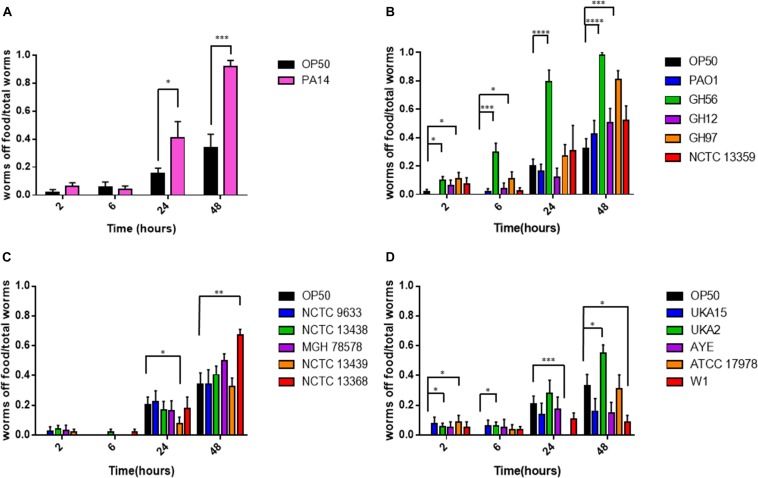
FIGURE 2.
Food aversion for different bacterial pathogens relative to E. coli OP50. The proportion of worms off food for P. aeruginosa PA14 (A), other P. aeruginosa strains (B), K. pneumoniae (C), and A. baumannii (D) was measured at various time-points after exposure to the bacterial lawn as shown. These experiments were performed in at least triplicate for all strains. Error bars represent ± SEM. Analysis is by one-way ANOVA with Tukey’s multiple comparison. Significance relative to OP50 at the relevant time-point is shown. ∗P < 0.05, ∗∗P < 0.01, ∗∗∗P < 0.001, ****P < 0.0001.

