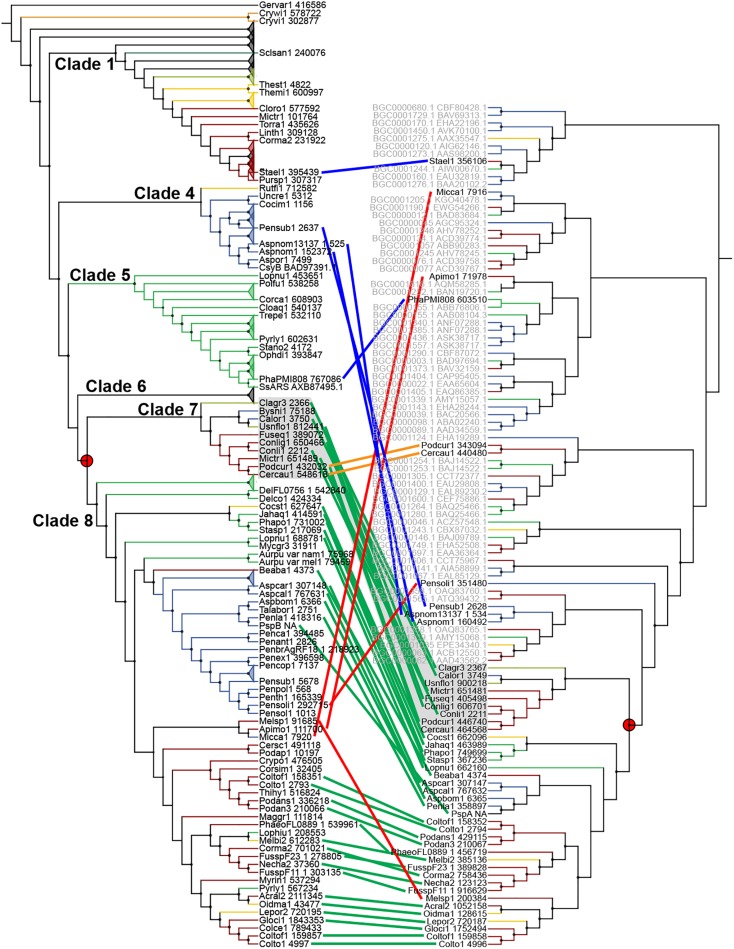
FIGURE 4.
Co-evolution of type III and reducing polyketide synthases (PKSs). Maximum-likelihood phylogenetic trees of genetically linked type III PKSs (left) and reducing PKSs (right). The rPKS tree comprises characterized fungal enzymes from the Minimum Information about a Biosynthetic Gene cluster (MIBiG) database (name written in gray with GenBank accession number) (Medema et al., 2015). Light green lines connect genes that co-evolved according to the common gene tree topologies. Red lines indicate linked genes that do not follow the expected tree topology. The orange lines indicate additional linkage with a second rPKS. Blue lines indicate independent linkage events. The red circles show the duplication event that resulted in the divergence of clades 7 and 8.

