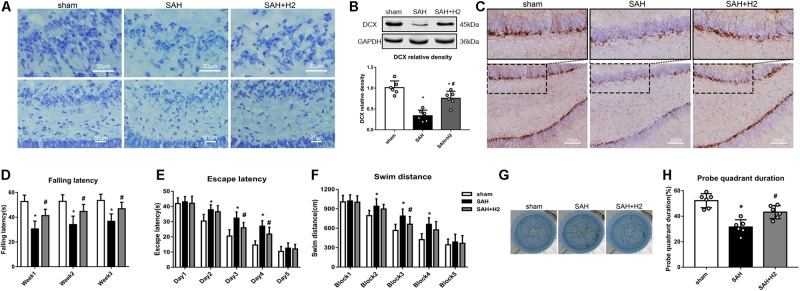
FIGURE 7.
Effect of hydrogen inhalation on long term neurobehavior after SAH. (A) Representative images of Nissl staining in the hippocampus. (B) Representative western blot images and quantitative analysis of doublecortin (DCX) expression. (C) Immunohistochemistry images of DCX in the hippocampus. (D) Rotarod test performed at weeks 1, 2, and 3 after SAH. (E) Escape latency and (F) Swim distance and (G) Representative trace images of water maze test performed at 3 weeks after SAH. (H) Probe quadrant duration in the probe trial test. Data represented as mean ± SD. n = 6 per group. ∗p < 0.05 vs. sham group; #p < 0.05 vs. SAH group.

