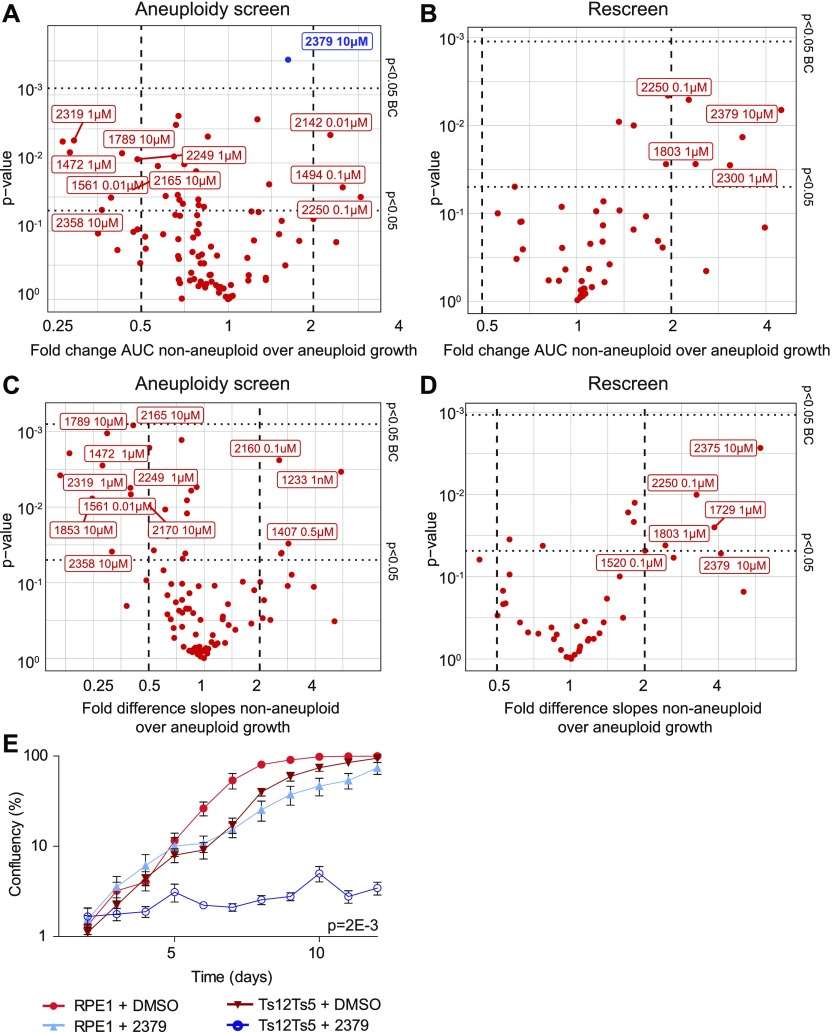
Figure 1. Aneuploid cells are sensitive to a metabolism-enhancing drug.
(A, B, C, D) RPE1 control cells and stable aneuploid RPE1 Ts12 Ts5 cells were screened with 95 drugs, each drug screened in triplicate. 45 drugs were rescreened. The P-values and the effect size for drug’s effect on RPE1 and RPE1 Ts12 Ts5 cells were plotted. (A, B, C, D) Data were analyzed through quantification of area under the curve (AUC, A, B), and slope analysis (C, D) of both the initial screen (A, C) and rescreened drugs (B, D). Drugs with difference >1 and P-value < 0.05 after Bonferroni correction are indicated in blue. (E) Validation growth curves of RPE1 control and RPE1 Ts12 Ts5 cells with and without 10 μM 2,379. Data were obtained by sequential daily microscope images and analyzed by FIJI-PHANTAST. All data involve at least three biological replicates, each with three technical replicates. Error bars indicate SEM. P-values are calculated in two-sided t test for AUC, correcting for cell line control. DMSO control curves are shared with Figs S1C and S3G.

