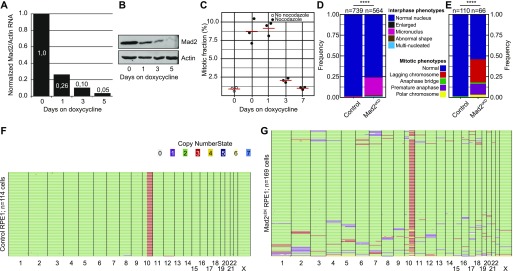
Figure 2. Engineering a cell line for conditional CIN.
(A) Quantitative PCR for Mad2 RNA levels over time in Mad2cKD RPE1 cells. (B) Western blot for Mad2 levels over time in RPE1 in Mad2cKD RPE1 cells. (C) Mitotic accumulation of nocodazole-challenged control and Mad2cKD RPE1 cells measured by phosphorylated histone H3. (D, E) Quantification of mitotic phenotypes of control and Mad2cKD RPE1 cells assessed by time-lapse imaging for interphase cells (D) and mitotic cells (E). “n” refers to the number of cells analyzed, P-values from chi-squared test. Data also displayed in Fig 5H. (F, G) Single-cell whole-genome sequencing data quantified by AneuFinder for RPE1 control cells (F, 114 cells, 2 aneuploid) and Mad2cKD RPE1 cells after 5 d of doxycycline treatment (G, 169 cells, 76 aneuploid). Colors refer to the copy number state for each chromosome (fragment).

