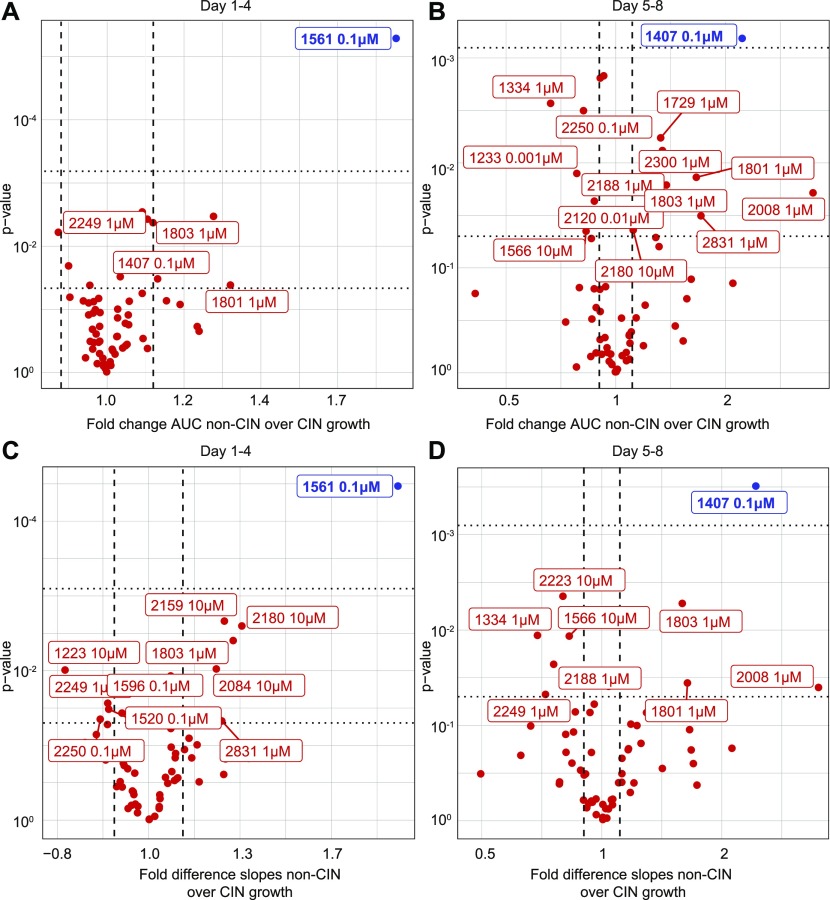
Figure 3. Screen for compounds that selectively kill CIN cells reveals several candidates.
(A, B, C, D) Growth curves of control and Mad2cKD RPE1 cells were analyzed during the first half (day 1–4) (A, B) and the second half (day 5–8) of the screen (C, D). (A, B, C, D) The non-CIN over CIN ratios for AUC (A, C) and slope analysis (B, D) were plotted per drug against the P-value. All drugs with log of difference >|0.15|, and P-value < 0.05 are plotted; drugs with P-values < 0.05 after Bonferroni correction are labeled blue.

