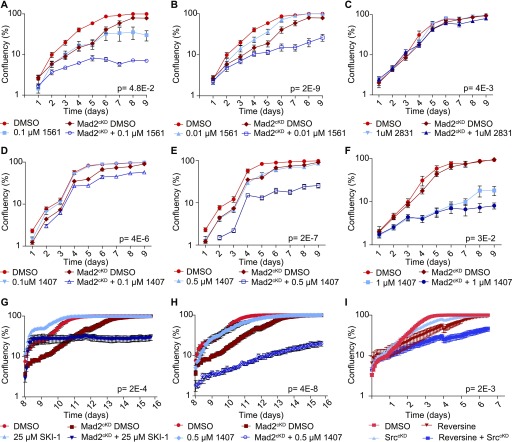
Figure 4. Validating candidate compounds that selectively target CIN cells.
(A, B, C, D, E, F) Growth curves of control and Mad2cKD RPE1 cells treated with 0.1 μM (A) and 0.01 μM (B) compound #1561, (C) 1 μM compound #2831, (D, E, F) 0.1 μM, 0.5 μM, and 1 μM 1,407, respectively. Data were obtained by sequential daily microscope images and analyzed by FIJI-PHANTAST. Each point is a minimum of three biological replicates, each of which contains three technical replicates. Plotted is log-scaled percentage confluency (cell coverage) over time. Error bars indicate SEM. P-values are calculated from paired, one-sided t tests of AUC corrected for cell line control. RPE1 DMSO and Mad2cKD DMSO curves shared between (A) and (B), and between (C) and (F) and Fig S3C, and between (D) and (E). (G, H) IncuCyte growth curves of control and Mad2cKD RPE1 cells treated with Src inhibitors SKI-1 (G) or compound #1407 (H, SKI606) for day 8–16. (I) IncuCyte growth curves for control- and reversine-treated RPE1 cells with and without conditional Src knockdown. All points include data for six technical replicates. Error bars refer to SEM, and P-values were calculated from two-sided t test of the AUC corrected for cell line controls. Data for DMSO control curves are shared between (G, H) and Fig 5G.

