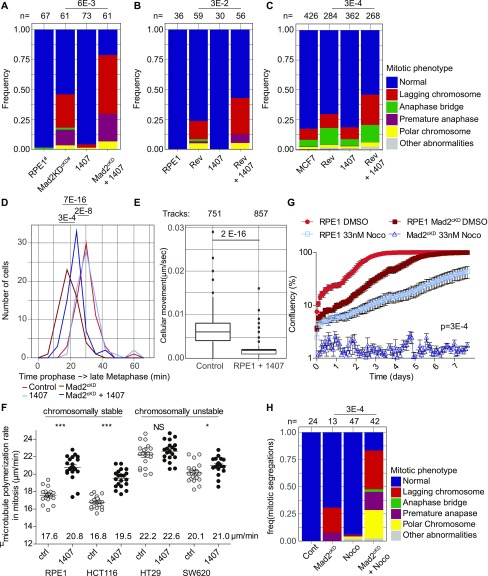
Figure 5. 1,407 significantly increases CIN in spindle assembly checkpoint (SAC)–deficient cells by altering microtubule (MT) dynamics.
(A, B, C) Frequency of mitotic abnormalities in control and Mad2cKD RPE1 cells with and without 0.5 μM compound #1407 (A), RPE1 cells with 150 nM reversine with and without 0.5 μM compound #1407 (B), and MCF7 cells treated with 15 nM reversine and/or 0.5 μM compound #1407 (C). Data were obtained by time-lapse microscopy imaging and include at least three biological replicates. P-values are calculated from chi-squared test. (D) Quantification of time from start prophase to late metaphase for control and Mad2cKD RPE1 cells with and without 0.5 μM compound #1407. At least 29 mitoses were analyzed per condition from a minimum of three time-lapse microscopy experiments. (E) Boxplot showing mean cell migration speed (μm/second) of RPE1 cells with or without 0.5 μM 1,407. Data include a minimum of three independent imaging experiments. P-values are calculated using a Wilcox test. (F) MT plus end growth rate in mitosis with and without 0.5 μM compound #1407. Each dot represents the average of 20 MT movements within a cell, 20 cells per condition. (G) IncuCyte-based growth curves of control and Mad2cKD RPE1 in the presence or absence of 33 nM nocodazole at days 8–16. AUC is plotted relative to cell line controls, P-values are calculated using a Wilcoxon–Mann–Whitney test. Data for DMSO control curves are also used in Fig 4G and H. (H) Frequency of mitotic abnormalities in RPE1 cells with or without 0.5 μM compound #1407 and/or 33 nM nocodazole. Data were obtained by time-lapse microscopy imaging and include at least three biological replicates. P-values are calculated by chi-squared test. “n” referrers to the number of mitotic events per condition. “#” refers to that the same data are also used in Fig 2E.

