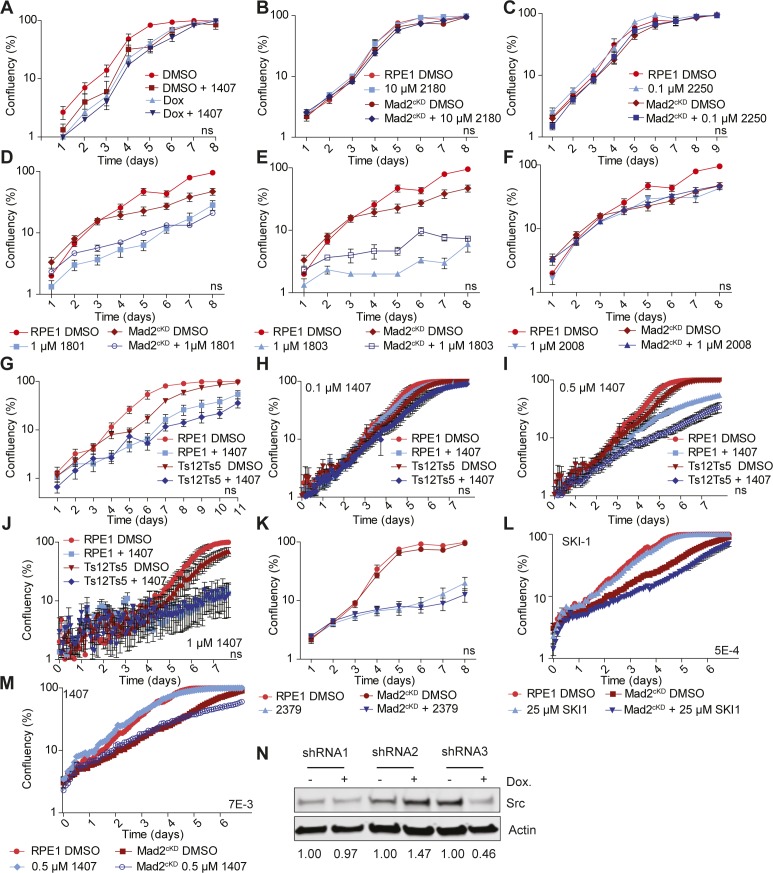
Figure S3. Validating CIN screen setup and hits.
(A) Growth curve of doxycycline-treated RPE1 cells with or without 0.5 μM compound #1407. Data were obtained by sequential daily microscope images and analyzed by FIJI-PHANTAST. Each data point includes three technical triplicates. P-values are calculated from two-sided t test. (B, C, D, E, F) Growth curves of control and Mad2cKD RPE1 cells treated with compounds #2180 (B), #2250 (C), #1801 (D), #1803 (E), and #2008 (F), respectively. Data were obtained by sequential daily microscope images and analyzed by FIJI-PHANTAST. Each data point includes three technical triplicates. P-values are calculated from one-sided t test. Data for DMSO control curves are shared between (B) & Fig S3K, between (D), (E), and (F) and between (C) and Fig 4C and F. (G) Growth curves of RPE1 control and RPE1 Ts12 Ts5 cells with or without 0.5 μM compound #1407. Data were obtained by sequential daily microscope images and analyzed by FIJI-PHANTAST. Data include three biological replicates, each with three technical replicates. P-values are calculated from two-sided t test. Data for DMSO control curves are shared with Figs 1E and S1C. (H, I, J) IncuCyte-derived growth curves of RPE1 and RPE1 (Ts12 Ts5) cells treated with 0.1 (H), 0.5 (I), and 1 μM compound #1407 (J). Data represent three technical replicates per condition. P-values are calculated by two-sided t test. (K) Growth curve of RPE1 control and RPE1 Mad2cKD cells with or without 10 μM compound #2379. Data were obtained by sequential daily microscope images and analyzed by FIJI-PHANTAST. Data include three biological replicates, each with three technical replicates. P-values are calculated from two-sided t test. Data for DMSO control curves are shared with Fig 3B. (L, M) IncuCyte-derived growth curves (days 1–4) of control and Mad2cKD RPE1 cells treated with 25 μM SKI-1 (L) or 0.5 μM compound #1407 (M) with six replicates each. P-values are calculated from two-sided t test. Data for DMSO control curves are shared between (L), (M), and Fig S5C. Error bars indicate the SEM between measurements. t tests are based on the AUC corrected for cell line controls. (N) Western blot for Src knockdown efficiency for three doxycycline-inducible shRNA constructs. Actin is used as a loading control. Numbers under blots refer to knockdown efficiency and are normalized to Actin and matched doxycycline-untreated sample.

