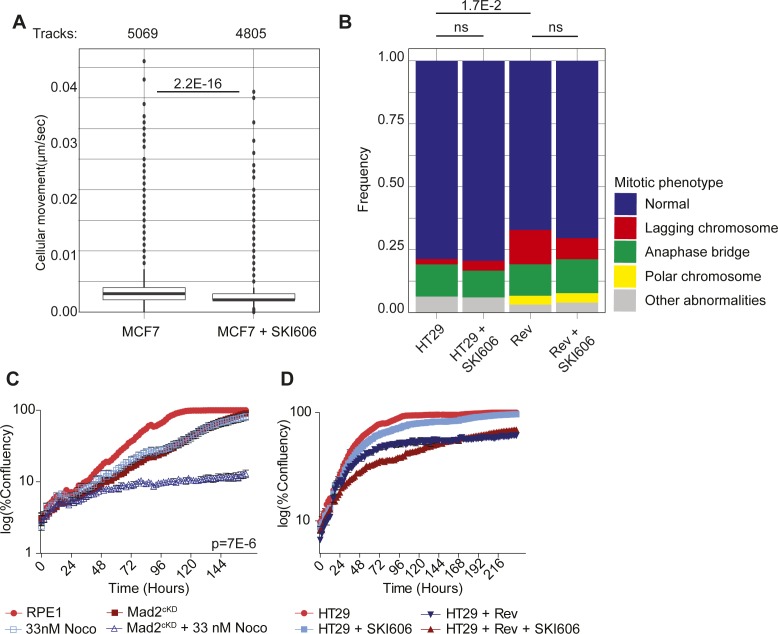
Figure S5. Src inhibition leads to increased MT polymerization rates.
(A) Mean cell movement speed (μm/sec) of MCF7 cells with or without 0.5 μM of SKI606. Data include a minimum of three independent imaging experiments. P-values are calculated through a Wilcoxon–Mann U test. (B) Frequency of mitotic abnormalities observed in HT29 cells incubated with or without 150 nM reversine and/or 0.5 μM SKI606. Data include a minimum of three independent time-lapse imaging experiments, and a minimum of 90 mitotic events per condition. P-value was calculated from a chi-squared test. (C) IncuCyte-derived growth curves (day 1–7) of control and Mad2cKD RPE1 cells with or without 10 ng/ml nocodazole. Data include six replicates each. P-value was calculated from a two-sided t test on the AUCs relative to the cell line’s control. Data for DMSO control curves are shared with Fig S3L and M. (D) IncuCyte-derived growth curves of HT29 cells with or without 150 nM reversine and/or 0.5 μM SKI606. Data include six replicates for each condition. P-value was calculated from a one-sided t test of the AUC relative to the cell line’s control.

