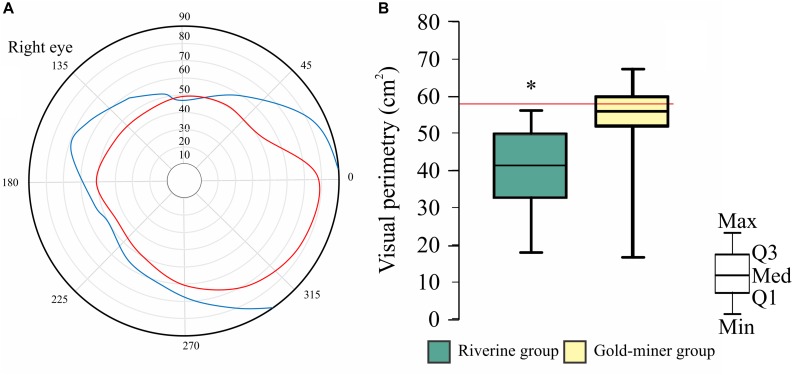
FIGURE 3.
Visual perimetric results. (A) Visual perimetry of a standard observer (blue line) and of a mercury exposed observer (red line). (B) Visual perimetric area distribution of the riverine (green box-plot) and gold-miner (yellow box-plot) group. ∗Significant difference, p < 0.05. Box-plots are composed by first (Q1), second (Q2), and third (Q3) quartiles, and whiskers represent the maximum (Max) and minimum (Min) values.

