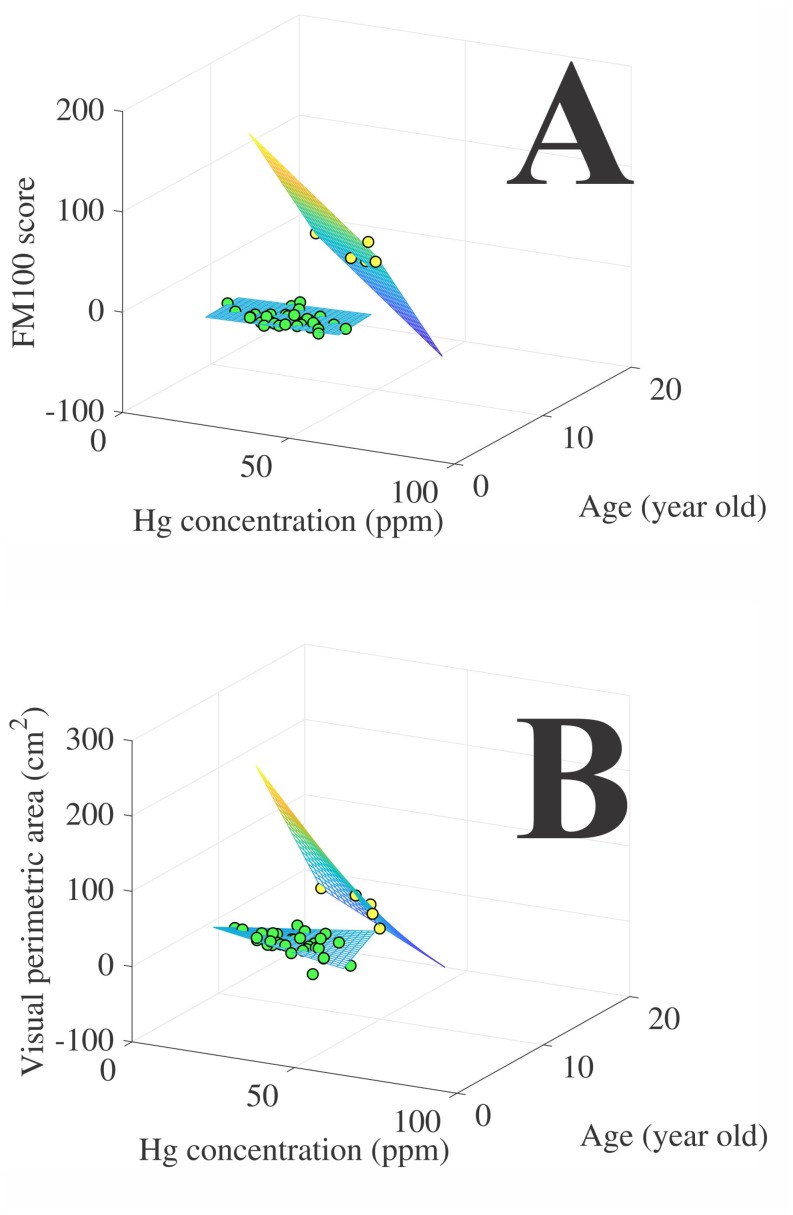
FIGURE 5.
Multiple regression between the visual outcomes (A, hue ordering test performance; B, visual perimetric area) and the independent variables (age and hair mercury concentration). Green circles represent the riverines data points (n = 5) and yellow circles represent gold-miners data points (n = 34). The grid represents the best three-dimensional model that fitted the visual outcomes to the independent variables.

