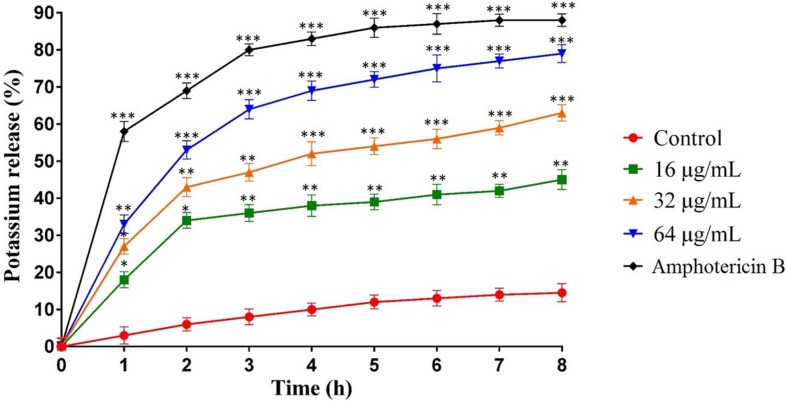
FIGURE 3.
Effect of MCh-AMP1 on the potassium release of C. albicans ATCC 10231 is indicated. C. albicans cells were treated with different concentrations of MCh-AMP1 (16–64 μg/mL) and amphotericin B (2 μg/mL) for 3 h. The results are based on three independent experiments and represent the average, standard deviation, and P-values (∗p ≤ 0.05, ∗∗p ≤ 0.01, ∗∗∗p ≤ 0.001) denote statistically significant differences from the effect of MCh-AMP1 on the control cells.

