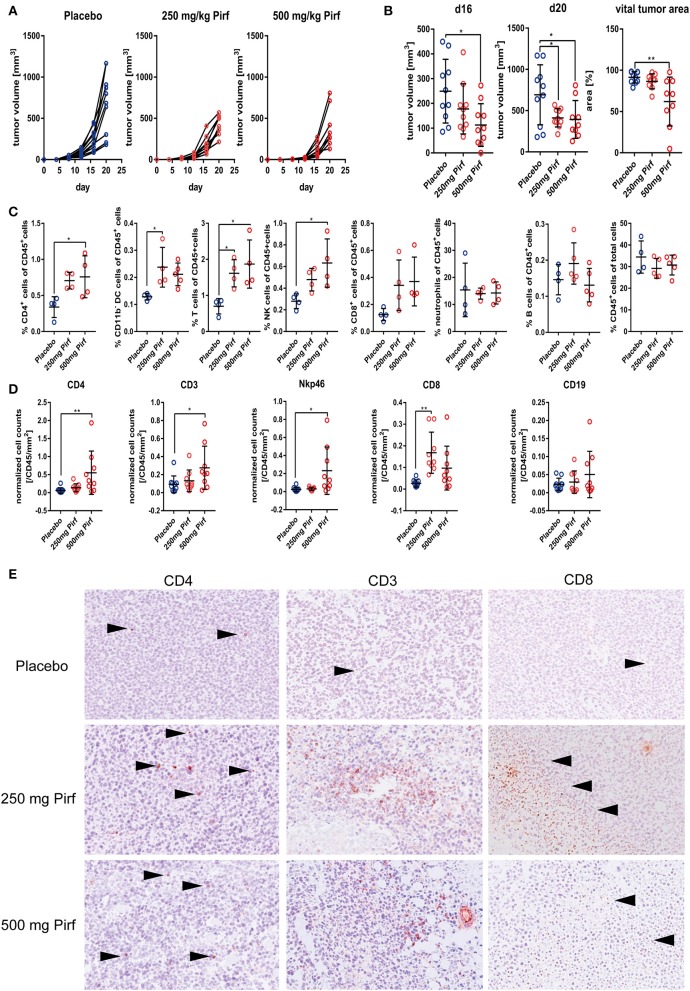
Figure 3.
Effect of Pirfenidone in subcutaneously transplanted LLC1 cells. (A) Measurement of tumor volume during course of in vivo experiment with 250 mg/kg body weight Pirfenidone, 500 mg/kg body weight or respective vehicle control (Placebo). (B) Quantification of tumor volume at d16 and d20 as well as percentage of vital tumor area at d20 comparing Pirfenidone treated groups with Placebo control group. (C) Flow cytometry analysis of digested tumor tissues for relative abundance of invaded immune cell populations targeting CD45+ cells, CD4+, CD8+, neutrophils, B cells, CD11b– DCs, T cells, and NK cells. Statistical evaluation performed as indicated above. (D) Additional phenotyping of intra-tumoral immune cells as performed by IHC targeting CD4, CD8, CD19, CD3, and Nkp46 with exemplary images of CD3, CD4, and CD8 IHC taken at 20x magnification (E). 1W-ANOVA with Dunnett's multiple comparison test considering *p ≤ 0.05, **p ≤ 0.01 significant was used for (B–D).

