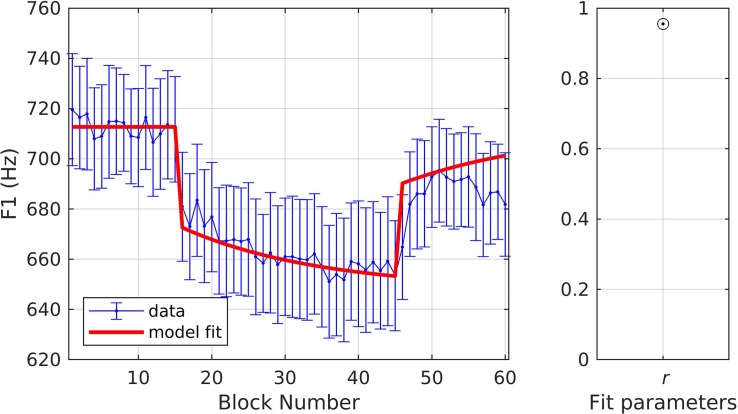
FIGURE 11.
Simulation 9: model fits of a dataset with perturbations applied to F1 and with a sudden ramp phase. Model parameters were fixed using the parameters in simulation 9 (data from Chao and Daliri, unpublished data). (Left) Mean and standard error of experimental data in blue; model fit in red. (Right) Fit quality (r = correlation coefficient).

