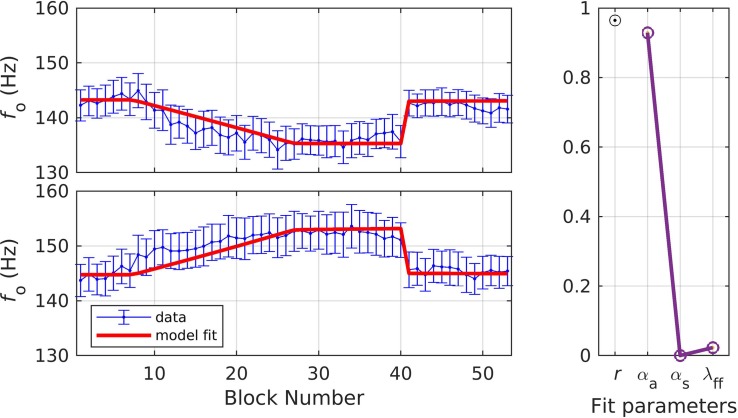
FIGURE 7.
Simulation 5: model fits of a dataset with perturbations applied to fundamental frequency in both shift-up and down directions; shift-up and down data are fit simultaneously (data from Abur et al., 2018). (Left) Mean and standard error of experimental data in blue; model fit in red. (Right) Fit quality and optimized parameter values (r = correlation coefficient; αA = auditory feedback control gain, αs = somatosensory feedback control gain, and λFF = learning rate).

