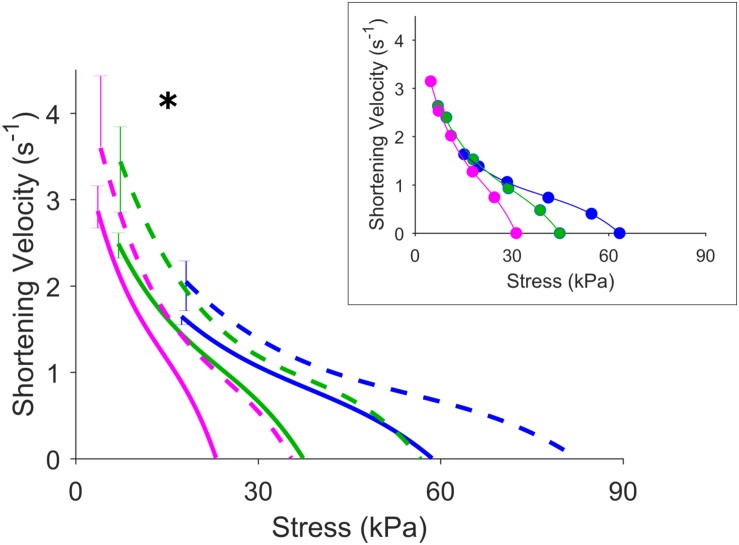
FIGURE 6.
Effects of increased contractility on velocity of shortening. Inset shows representative data for a Control muscle. The asterisk indicates that the velocity of shortening at the lowest afterload of work loop contraction for the three initial muscle lengths is greater for the Isoproterenol group (dashed lines) compared with the Control group (solid lines). Blue, green, and magenta colored lines represent work-loop contractions starting at Lo, 0.95 Lo, and 0.90 Lo, respectively.

