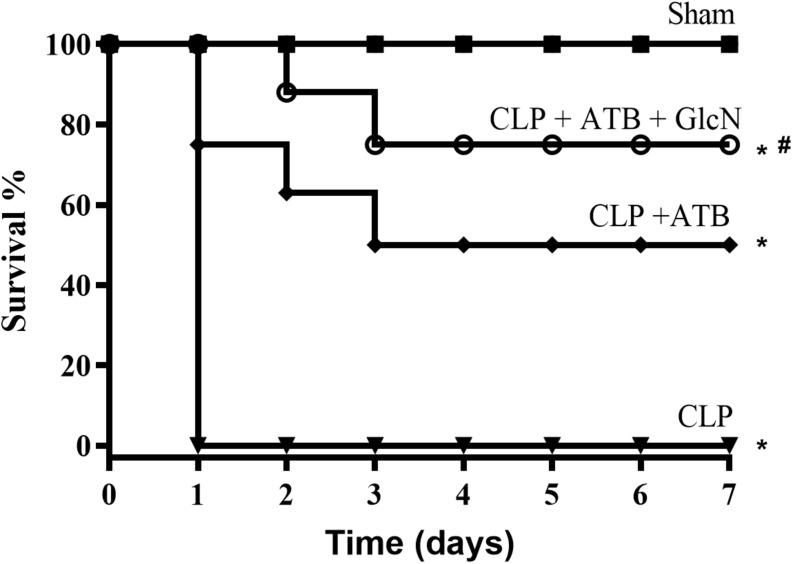
FIGURE 12.
Survival rate in mice of the control group (Sham) and mice submitted to cecal ligation and puncture-induced sepsis (CLP); CLP + ATB (treatment with sodium ertapenem 30 mg/kg s.c.), and CLP + ATB + GlcN (300 mg/Kg, i.v.). Survival rates were determined every 12 h for 7 days and the results are expressed as the percentage of animals alive on each day. ∗p < 0.05 vs. control. #p < 0.05 vs. CLP + ATB. N = 10 animals per experimental group. Log-rank test.

