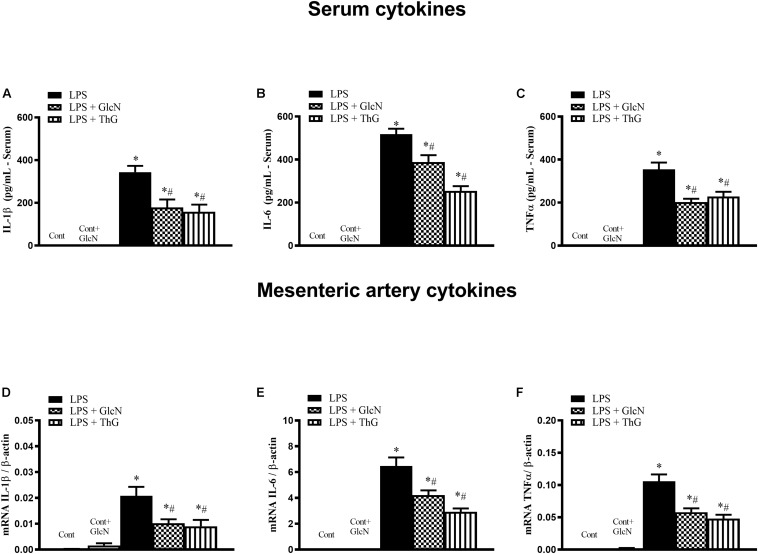
FIGURE 3.
Systemic and vascular production of IL-1β, IL-6, and TNF-α. Evaluation of (A–C) serum concentration and (D–F) mesenteric artery mRNA of (A,D) IL-1β, (B,E) IL-6, and (C,F) TNF-α in mice submitted to LPS-induced SIRS and treated with vehicle (LPS), GlcN (LPS + GlcN) or ThG (LPS + ThG). The results are expressed as mean ± SEM and are representative of 3–4 experiments. ∗p < 0.05 vs. control; #p < 0.05 vs. LPS. One-way ANOVA followed by Dunnett’s post-test.

