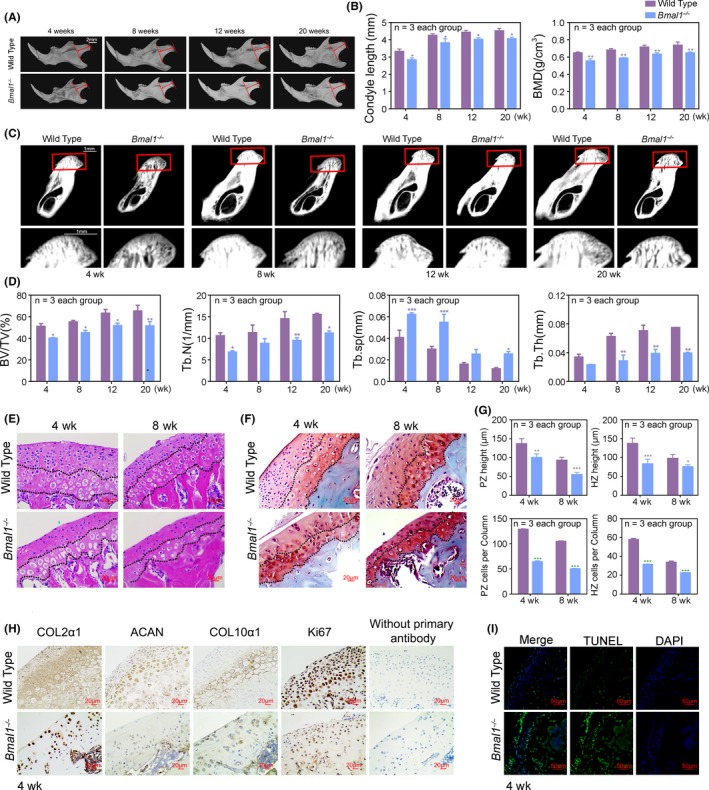
Figure 2.

Loss of BMAL1 delays and reduces chondrogenesis and endochondral ossification in mandibular condyle. A, Representative images of micro‐CT reconstruction of mandibles (n = 3 per group). Red arrow indicated the mandibular condyle length. Scale bar, 2 mm. B‐D, Representative images and analysis of length, BMD, BV/TV, Tb.N, Tb.sp and Tb.Th of mandibular condyles (n = 3 for each bar). Scale bar, 1 mm. Data represented as mean ± SD, * P < .05, ** P < .01, *** P < .001. E, F, Representative images of H&E and S‐O staining of mandibular condyles at 4‐wk‐old and 8‐wk‐old (n = 3 per group). Scale bar, 20 μm. G, The height and the number of chondrocytes per column in PZ and HZ of mandibular condyle cartilages (n = 3 for each bar). Data represented as mean ± SD, *** P < .001. H, Immunohistochemistry of COL2α1, ACAN, COL10α1 and Ki67 in mandibular condyles at ZT10, without primary antibody as negative group (n = 3 per group). Scale bar, 20 μm. I, The cell apoptosis of mandibular condyles was detected by TUNEL staining (n = 3 per group). Scale bar, 50 μm
