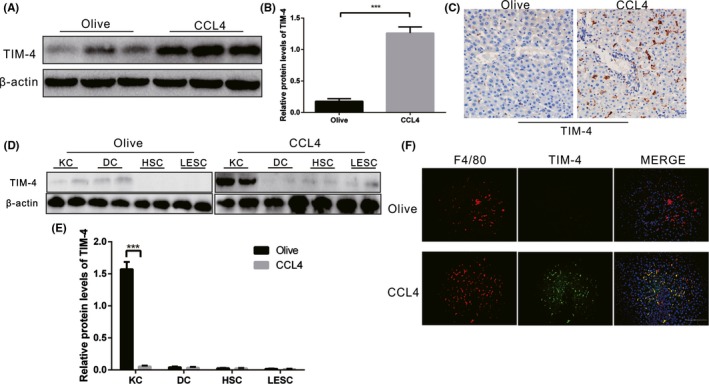
Figure 1.

TIM‐4 in KCs is increased during liver fibrosis. A, B, Immunoblot and quantitative analysis of TIM‐4 expression in olive‐induced and CCL4‐induced liver (n = 3 mice/ group). C, The expression levels of TIM‐4 in olive‐induced and CCL4‐induced liver were assessed using immunohistochemistry (n = 3 mice/ group, magnification, ×400). D, Kupffer cells (KCs), dendritic cells (DCs), hepatic stellate cells (HSCs) and liver sinusoidal endothelial cells (LESCs) were isolated from olive‐induced and CCL4‐induced mice, and the (E) expression levels of TIM‐4 were assessed with immunoblot (n = 3 mice/ group). F, F4/80 (red) and TIM‐4 (green) expression in olive‐induced and CCL4‐induced liver tissues were detected by immunofluorescence (n = 3 mice/ group, magnification ×400, Scale bars: 50 μm). ***P < .0001. Values are the mean ± SD of a minimum of three independent experiments
