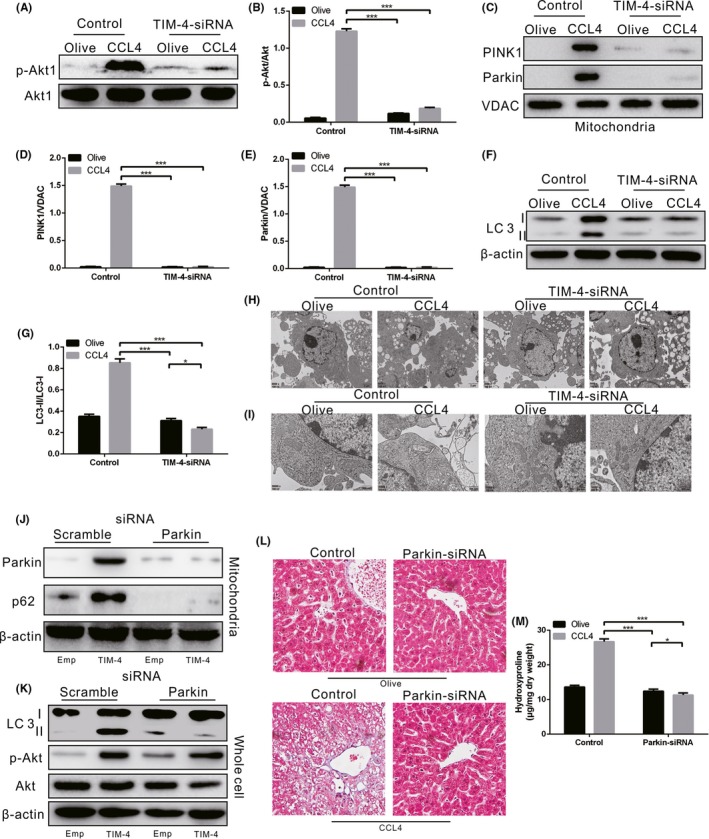
Figure 5.

TIM‐4 in KCs mediates mitophagy via Akt1 during liver fibrosis. A‐B, The expression of p‐Akt1 in KCs from olive‐induced and CCL4‐induced mice with or without TIM‐4 interference was determined by immunoblot and quantitative analysis (n = 3 mice/ group). C‐G, The expression levels of PINK1, Parkin and LC3 II/I in KCs from olive‐induced and CCL4‐induced mice with or without TIM‐4 interference were determined by immunoblot and quantitative analysis (n = 3 mice/ group). H, I, Vacuoles (Scale bars: 2 μm) and mitochondria (Scale bars: 500 nm) in KCs from olive‐induced and CCL4‐induced mice with or without TIM‐4 interference were observed under transmission electron microscopy (n = 3 mice/ group). J‐K, The expression levels of mitochondrial Parkin and p62, along with LC3 II/I, were measured in KCs transfected with scrambled or Parkin2 siRNA in combination with empty or TIM‐4 overexpression adenovirus (n = 3 mice/ group). L, Liver tissues from olive‐induced and CCL4‐induced mice with or without Parkin interference were stained with Sirius red (n = 3 mice/ group, magnification, x400). M, Hydroxyproline of livers removed from olive‐induced and CCL4‐induced mice with or without Parkin interference (n = 3 mice/ group). *P < .05; ***P < .0001. Values represent the mean ± SD of at least three independent experiments
