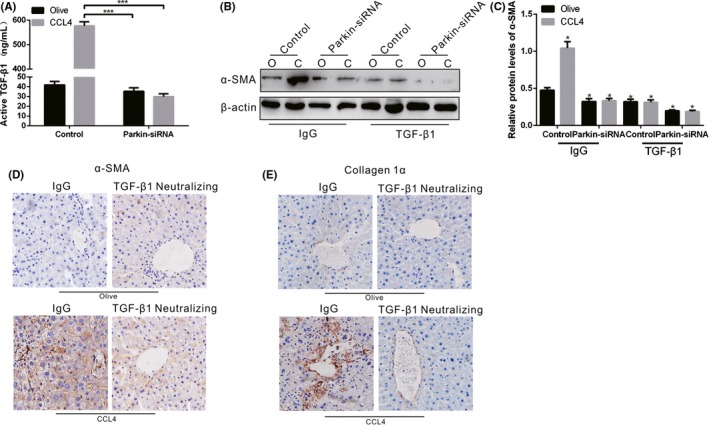
Figure 7.

KC mitophagy regulates TGF‐β1 during liver fibrosis. A, The concentration of TGF‐β1 in livers from olive‐induced and CCL4‐induced mice with or without Parkin interference was measured by ELISA (n = 3 mice/ group). B, C, The α‐SMA expression in HSCs cultured in KC supernatant from olive‐induced and CCL4‐induced mice with or without Parkin interference was determined by immunoblot and quantitative analysis. The supernatant was pre‐incubated with IgG control or neutralized with TGF‐β1 antibody (10 mg/mL). D, E, The expression levels of α‐SMA and collagen 1α in olive‐induced and CCL4‐induced mice with IgG or TGF‐β1 antibody treatment were assessed using immunohistochemistry (n = 3 mice/ group, magnification, x400). *P < .05; ***P < .0001. Values represent the mean ± SD of at least three independent experiments
