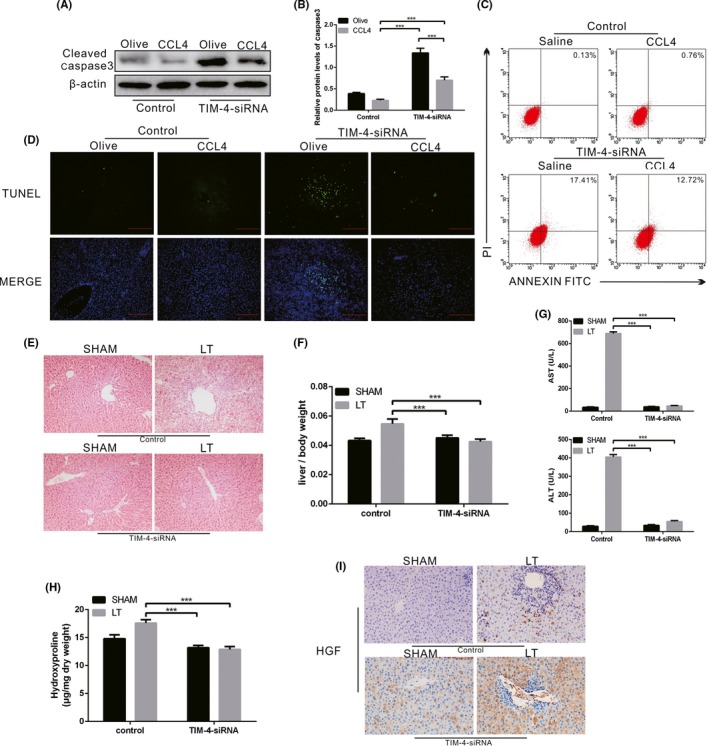
Figure 8.

TIM‐4 in KCs mediates mitophagy via Akt1 during liver fibrosis. A, B, The expression levels of cleaved caspase‐3 in KCs from olive‐induced and CCL4‐induced mice with or without TIM‐4 interference were determined by immunoblot and quantitative analysis (n = 3 mice/ group). C, The number of apoptotic KCs from olive‐induced and CCL4‐induced mice with or without TIM‐4 interference was determined with annexin V/PI staining and flow cytometric analysis (n = 3 mice/ group). D, Representative liver sections stained with terminal deoxynucleotidyl transferase‐mediated dUTP‐biotin nick end labelling assay (TUNEL) in sham and liver transplantation mice with or without TIM‐4 interference (n = 3 mice/ group). E, Representative micrographs of the pathological damage observed in sham and liver transplantation mice with or without TIM‐4 interference following staining with haematoxylin and eosin (n = 3 mice/ group, magnification, x400). F, The ratio of liver weight to body weight was measured in sham and liver transplantation mice with or without TIM‐4 interference (n = 5 mice/ group). G, Serum concentrations of alanine aminotransferase (ALT) and aspartate transaminase (AST) in sham and liver transplantation mice with or without TIM‐4 interference (n = 5 mice/ group). H, Hydroxyproline of livers removed from sham and liver transplantation mice with or without TIM‐4 interference (n = 5 mice/ group). I, The expression levels of hepatocyte growth factor (HGF) in sham and liver transplantation mice with or without TIM‐4 interference were assessed using immunohistochemistry (n = 5 mice/ group, magnification, x400). ***P < .0001. Values represent the mean ± SD of at least three independent experiments
