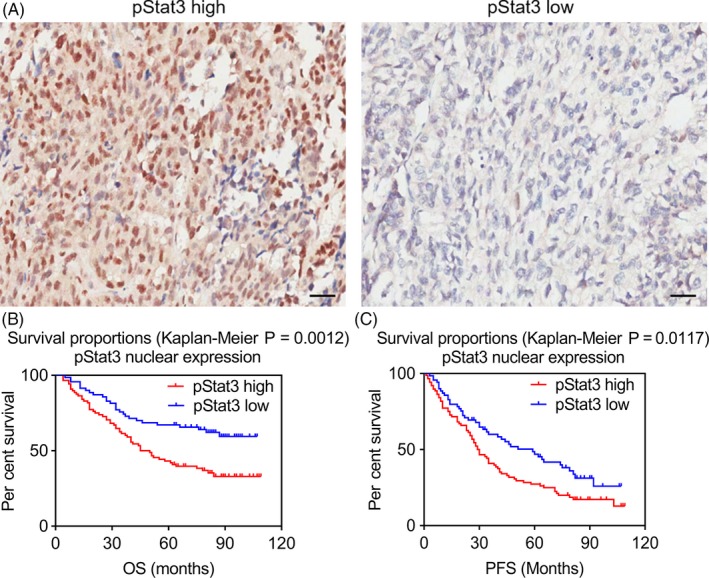
Figure 1.

Survival curves of ovarian cancer patients grouped by nuclear pStat3 expression in EOC tissues. (A) Immunohistochemistry images with labelled pStat3 high/low were representative regions of pStat3 expression in ovarian tumour microarray (magnification, ×200). (B) and (C) Association of pStat3 expression with the patients’ overall survival (OS) and progression‐free survival (PFS) in EOC, respectively
