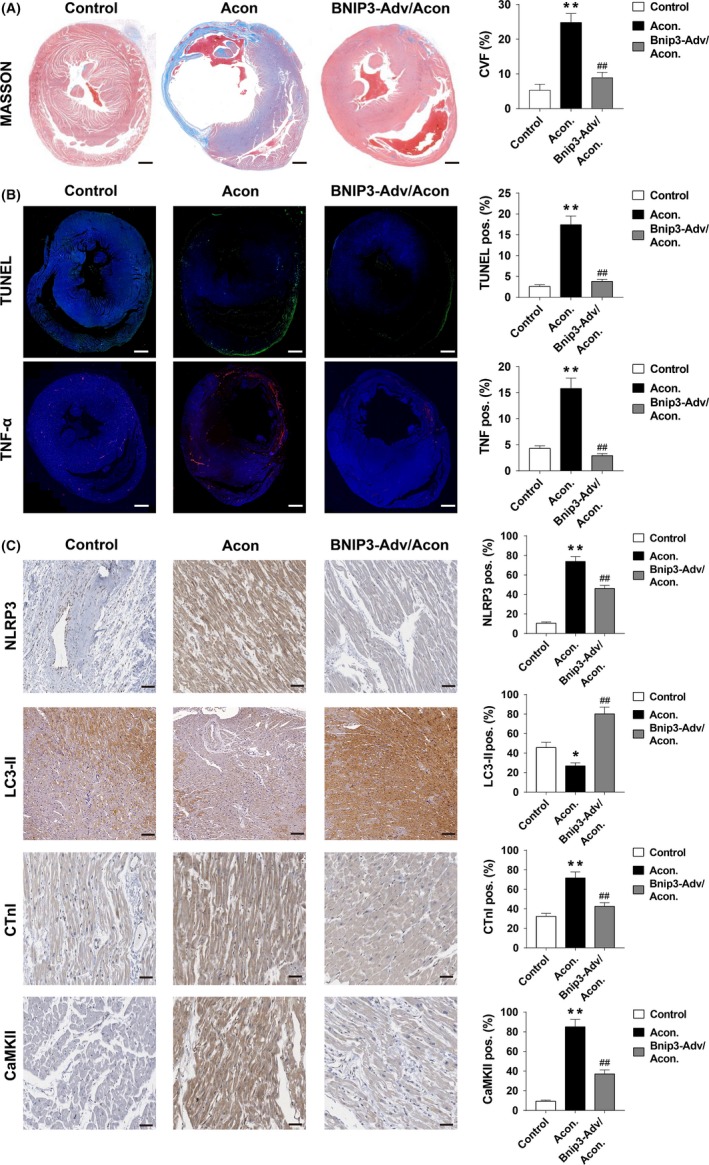
Figure 8.

A, Masson's trichrome staining of myocardial tissue sections of control, aconitine treated and aconitine plus BNIP3‐OE rats, scale bar: 1 mm. B, immunofluorescent staining of TUNEL and TNFα in myocardial tissue sections of control, aconitine treated and aconitine plus BNIP3‐OE rats, scale bar: 1 mm. C, The immunohistochemistry analysis of NLRP3, LC3, CTnI and CaMKII in myocardial tissue sections of control, aconitine treated and aconitine plus BNIP3‐OE‐treated rats, scale bar: 50 μm. *P < .05 vs control. **P < .01 vs control. ##P < .01 to aconitine‐treated group
