
Figure 6.
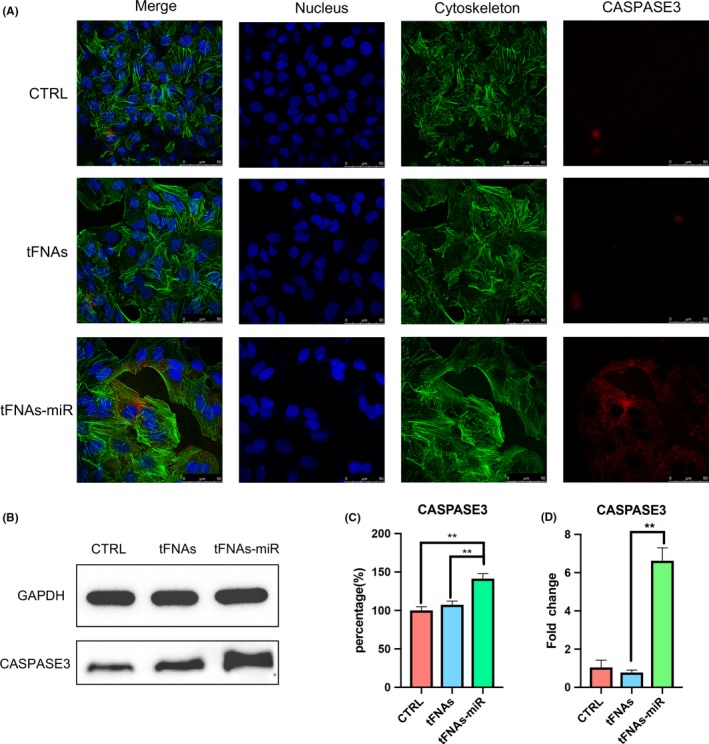
The expression of pro‐apoptotic protein‐Caspase3. A, Immunofluorescence detection of Caspase3 expression after treated with tFNAs and tFNAs‐miR‐214‐3p for 72 h. (nucleus: blue; cytoskeleton: green; Caspase3: red). Scale bars are 50 μm. B, Western blot detection of Caspase3. C, Quantification of Western blot. Data are presented as mean ± standard deviation (SD) (n = 4). Statistical analysis: **P < .01. D, qPCR analysis of Caspase3. Data are presented as mean ± standard deviation (SD) (n = 4). Statistical analysis: **P < .01