Figure 2.

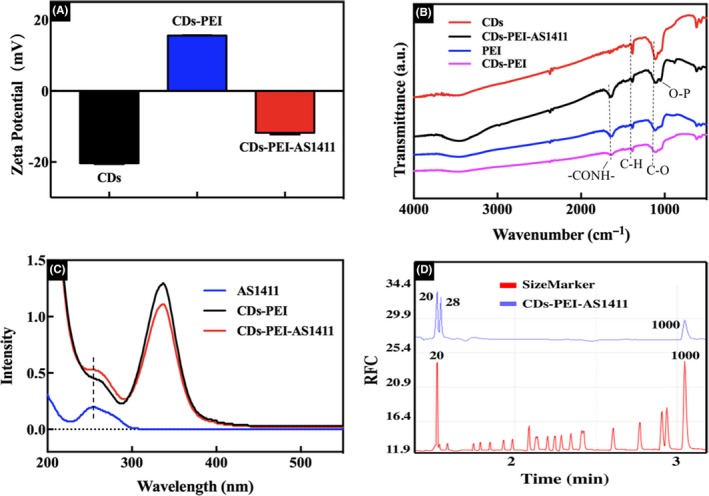
(A) Zeta potential values of CDs, CDs‐PEI and CDs‐PEI‐AS1411. (B) FTIR spectra of CDs, PEI, CDs‐PEI and CDs‐PEI‐AS1411. (C) UV‐vis spectra of AS1411, CDs‐PEI and CDs‐PEI‐AS1411. (D) Electropherograms of size marker and CDs‐PEI‐AS1411

(A) Zeta potential values of CDs, CDs‐PEI and CDs‐PEI‐AS1411. (B) FTIR spectra of CDs, PEI, CDs‐PEI and CDs‐PEI‐AS1411. (C) UV‐vis spectra of AS1411, CDs‐PEI and CDs‐PEI‐AS1411. (D) Electropherograms of size marker and CDs‐PEI‐AS1411