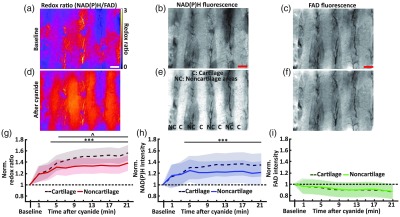
Fig. 2.

Redox imaging. Redox ratio images (a) before and (d) 21 min after cyanide treatment. NAD(P)H images (b) before and (e) 21 min after cyanide treatment. Regions with cartilage, “C,” and noncartilage, “NC,” regions can be discriminated. FAD images (c) before and (f) 21 min after cyanide treatment. Scale bar: . (G) By 5 min, the redox ratio significantly increased for both the cartilage and noncartilage regions compared to baseline (*** for , ). Beginning at 7 min, the redox ratio of the cartilage region was significantly higher than the noncartilage region (^ for ). (h) By 5 min, NAD(P)H intensity significantly increased in both the cartilage and noncartilage regions compared to baseline (*** for ). (i) Cyanide treatment resulted in no significant change in FAD intensity in both regions compared to baseline. Shaded region in (g), (h), and (i) is standard error of the mean.
