Figure 3.

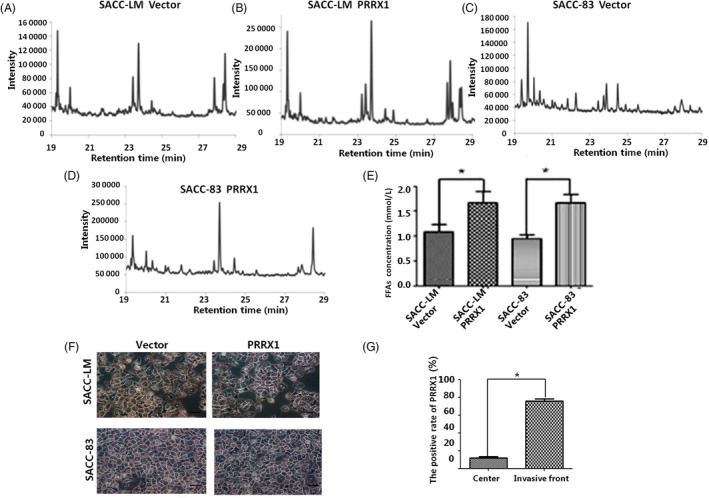
PRRX1 increased FFA level by mesenchymal cancer cells. A, B, The GC/MS chromatograms of free fatty acids in PRRX1 overexpressed SACC‐LM. In SACC‐LM cells, the composition of FFAs in PRRX1 overexpressed group was more complex than the vector, containing six different kinds of FFAs. C, D, The GC/MS chromatograms of free fatty acids in PRRX1 overexpressed SACC‐83 cells. In SACC‐83 cells, the composition of FFAs in PRRX1 overexpressed group was also more complex than the vector, containing five different kinds of FFAs, and carbon chain extension, the proportion of carbon 14 FFAs from 82.56% to 0.79%, the proportion of carbon 16 and 18 FFAs increased from 17.44% to 99.21%. E, The FFA quantitative comparison in PRRX1 overexpressed SACC‐LM and SACC‐83 cells with FFAs quantification colorimetric/fluorometric kit. The level of FFAs in PRRX1 overexpressed group was 1.54 times than the vector in SACC‐LM cells and 1.77 times in SACC‐83 cells (*P < .05). F, TG expression in PRRX1 overexpressed SACC‐LM and SACC‐83 cells of (oil red O staining ×200). G, PRRX1 expression in the centre of SACC and the invasive front of SACC invasion to gland with IHC. The data showed that the positive rate of PRRX1 at the invasive front was significantly higher than that at the centre of SACC (*P < .05). Error bars represent the mean ± SD of triplicate experiments. Unpaired t test was performed to determine significance
