
Figure 4.
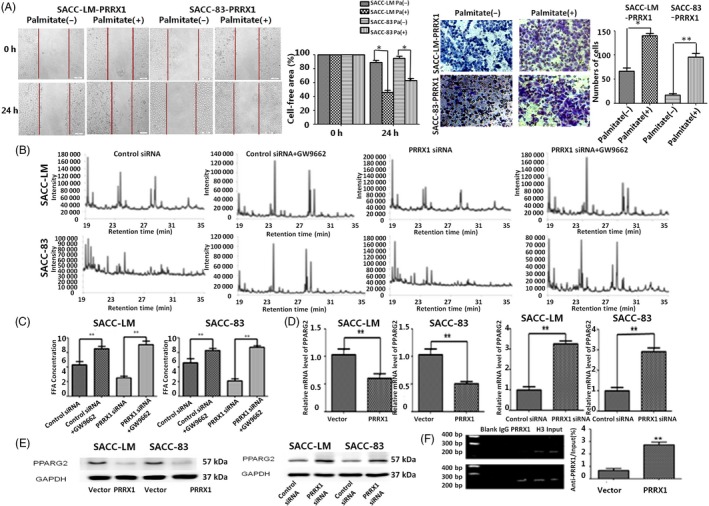
PRRX1 targeted regulating PPARG2 promoter and suppressed PPARG2 expression response to FFAs treatment. A, The PRRX1‐induced invasion and migration of SACC‐83 and SACC‐LM cells were enhanced in response to FFAs treatment. Pa: Palmitate. Error bars represent the mean ± SD of triplicate experiments. B, The GC/MS chromatograms of FFAs of the GW9662 stimulation SACC cells. Compared with the control group without GW9662, the composition of free fatty acids of the Rosiglitazone stimulating groups was more complex, and the long carbon chain extend product from C16 to C18 increased, and C19 and C20 emerged. C, The FFA level in the GW9662 stimulation of SACC cells by FFA quantification colorimetric/fluorometric kit (**P < .01). The FFA concentration of GW9662 stimulating group increased by 0.453 mmol/L and 1.107 mmol/L, respectively, in vector and PRRX1 groups in SACC‐LM cells, 0.411 mmol/L and 1.144 mmol/L, respectively, in vector and PRRX1 groups in SACC‐LM cells. D, The mRNA level of PPARG2 and PRRX1 was detected by RT‐PCR. The mRNA level of PPARG2 reduced to 52.17% and 49.63% in PRRX1 overexpressed SACC‐LM and SACC‐83 cells. The mRNA level of PPARG2 increased 3.17 and 2.95 times in PRRX1 siRNA groups of SACC‐LM and SACC‐83 cells, respectively. PPARG2 expression was significantly downregulated in PRRX1 overexpressed SACC‐LM and SACC‐83 cells, while PPARG2 expression was significantly upregulated by PRRX1 siRNA transfection (**P < .01). E, PPARG2 protein expression was detected by Western blot. The protein level of PRRX1 which aimed at PPARG2 was consistent with mRNA level. F, ChIP test showed that the combination capacity of PRRX1 and PPARG2 promoter in PRRX1 overexpressed group was significantly increased (**P < .01). Error bars represent the mean ± SD of triplicate experiments. Unpaired t test was performed to determine significance