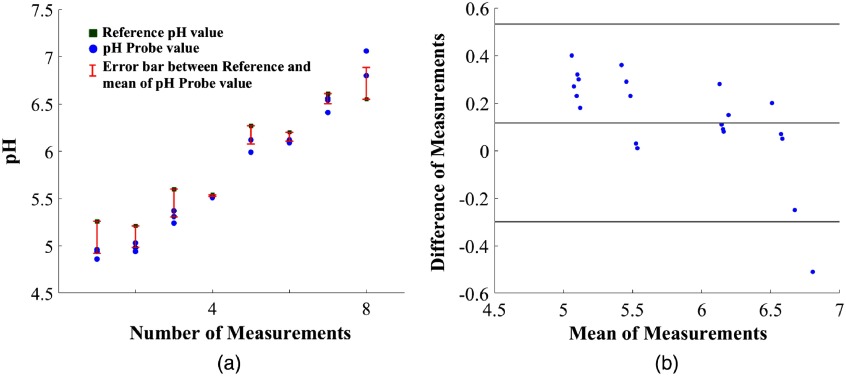
Fig. 6.
(a) In vitro measurements: reference measurements using the conventional pH meter in green square, repeatable measurements using the FL system in blue circles, and error bars between average of the three repeated measurements and reference system in red. (b) Bland–Altman plot between reference pH meter and predicted pH values for in-vitro tooth samples (using 95% agreement between variables).

