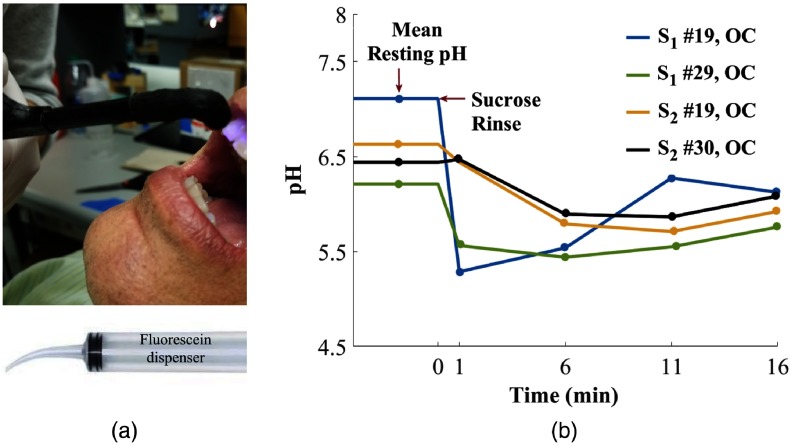
Fig. 7.
(a) In vivo measurement and (b) mean resting pH and sucrose response of two subjects after 0.3-M sucrose rinse. pH value before 0 min indicates mean resting pH of subject’s tooth. Tooth number is listed in the legend along with the surface (OC: occlusal). The time from 1 to 16 min is the dynamic sucrose response obtained by taking measurements every 5 min.

