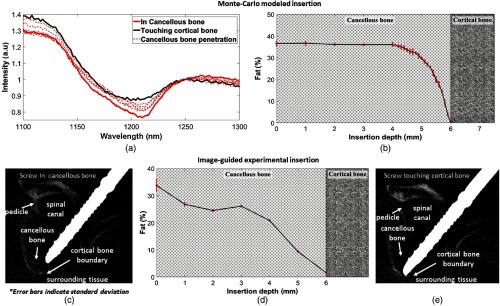
Fig. 8.
Comparison between simulated and measured probe insertion. (a) Simulated changes in DR spectra during the transition of the modeled optical probe from cancellous bone to cortical bone. (b) Corresponding drop in simulated fat content. (c) X-ray image showing optical screw probe in cancellous bone. (d) Drop in measured fat content as the optical screw probe approaches cortical bone. (e) X-ray image showing the tip of optical screw probe in contact with cortical bone.

