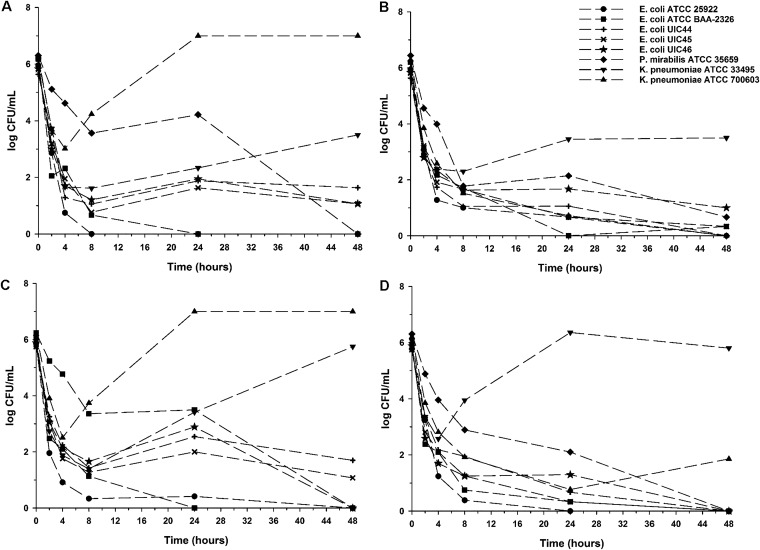
FIG 2.
Mean log10 CFU/ml versus time profile for each isolate against fosfomycin-laden urine collected from subjects during the QOD dosing regimen on day 5 without G6P (A) and with 25 mg/liter G6P (B) and during the QD dosing regimen on day 5 without G6P (C) and with 25 mg/liter G6P (D). Curves represent average concentrations for triplicate experiments. The y axis is in the log scale.

